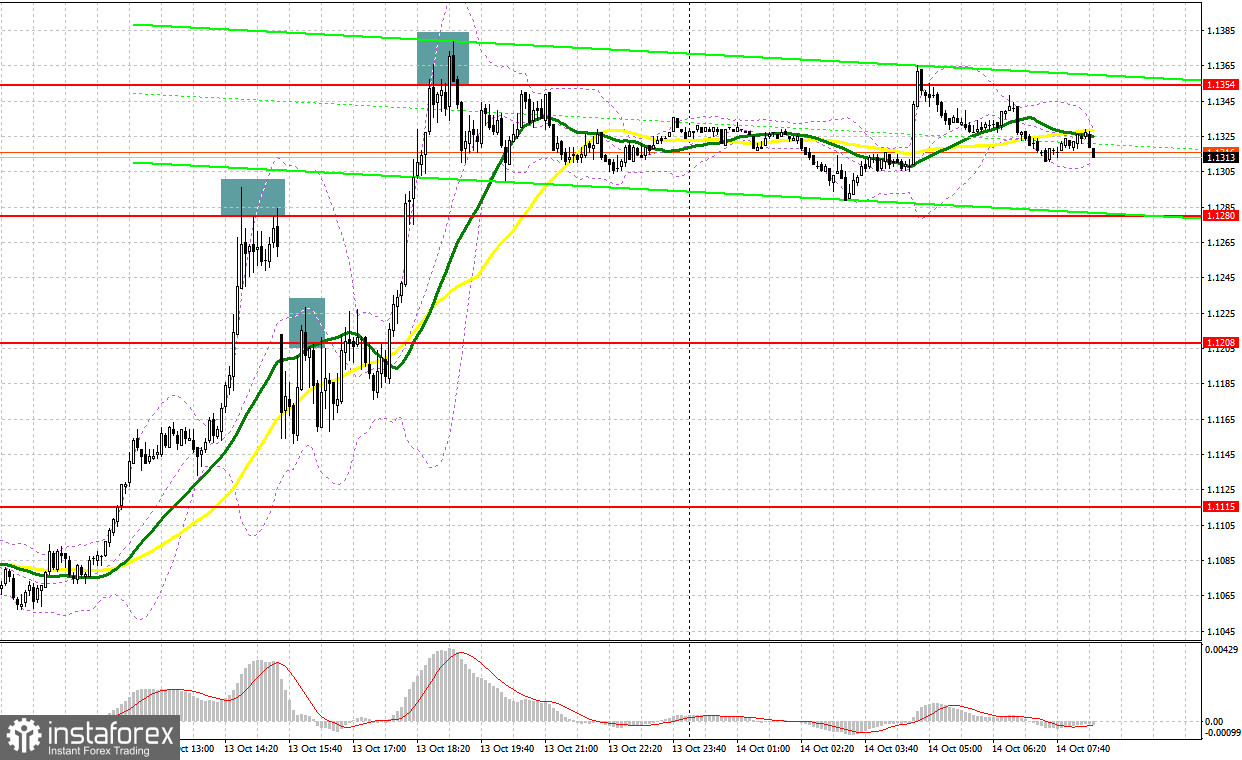
Several market entry signals were formed yesterday. Let's take a look at the 5-minute chart and figure out what happened. I paid attention to the 1.1110 level in my morning forecast and advised making decisions on entering the market there. The GBP/USD breakthrough and sharp rise above 1.1110 occurred without the reverse top-down test that I have shown on the chart, so it was not possible to enter long positions on the pair. In the afternoon, a false breakout at 1.1280 gave a sell signal, which caused the pound to fall by more than 120 points. A breakthrough with a reverse test from below 1.1208 created a sell signal, which made it possible to take about 40 more points.

When to go long on GBP/USD:
Markets continue to wonder if Bank of England Governor Andrew Bailey will extend the bond buying program or not. So far, judging by the way the pound has gained in price, many are confident that the head of the central bank will "bend" under pressure from politicians and extend this program. Such moves, however, go far against the central bank's plans to control inflation, and in an interview last week, Bailey made it clear that the bailout for the bond market would end this Friday. All in all, it's been a fun day for us today. Even despite the lack of important statistics, volatility can be quite high.
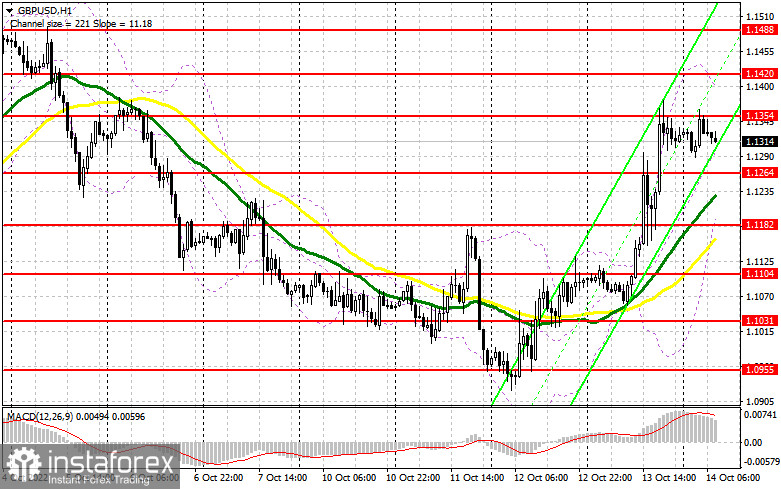
In case the pair goes down, forming a false breakout at the level of 1.1264 will give a buy signal with the goal of returning to 1.1354 - the resistance formed at the end of yesterday, above which it was not possible to get out even in today's Asian session. A breakthrough and a downward test of this range may pull the stop orders of speculators, which creates a new buy signal with growth to a more distant level of 1.1420. The most distant target will be a high of 1.12488, the update of which will put an end to the bear market observed at the beginning of this month. If the bulls do not cope with the tasks set and miss 1.1264, the pressure on the pair will quickly return, which will open the prospect of updating the weekly low of 1.1182, where the moving averages play on their side. I advise you to buy there only on a false breakout. I recommend opening longs on GBP/USD immediately for a rebound from 1.1104, or even lower - around 1.1031 with the goal of correcting 30-35 points within the day.
When to go short on GBP/USD:
The bears manage to control the market, this is especially evident after yesterday's US inflation report, which, although it turned out to be worse than economists' forecasts, still slowed down. If the bond purchase program ends today, then the pressure on the pound will return very quickly, although the central bank probably has some kind of "trump card" up its "sleeve" and it will not let the market fall just like that. Under these conditions, the best scenario for selling will be a false breakout in the resistance area of 1.1354, which was formed at the end of the Asian session. The target in this case will be the nearest support at 1.1264. A breakthrough and reverse test from the bottom to the top of this range will provide a good entry point with a new low at the 1.1182 area. The farthest target will be the area of 1.1104, where I recommend taking profits. We can also fall there after the US data, which we will discuss in more detail in the forecast for the second half of the day.
In case GBP/USD grows and the bears are not active at 1.1354, bulls will begin to return to the market, counting on offsetting the situation. This should push the pair to the 1.1420 area. Only a false breakout at this level will provide an entry point into short positions with the goal of a new decline. If traders are not active there, I advise you to sell GBP/USD immediately for a rebound from 1.1488, counting on the pair's rebound down by 30-35 points within the day.

COT report:
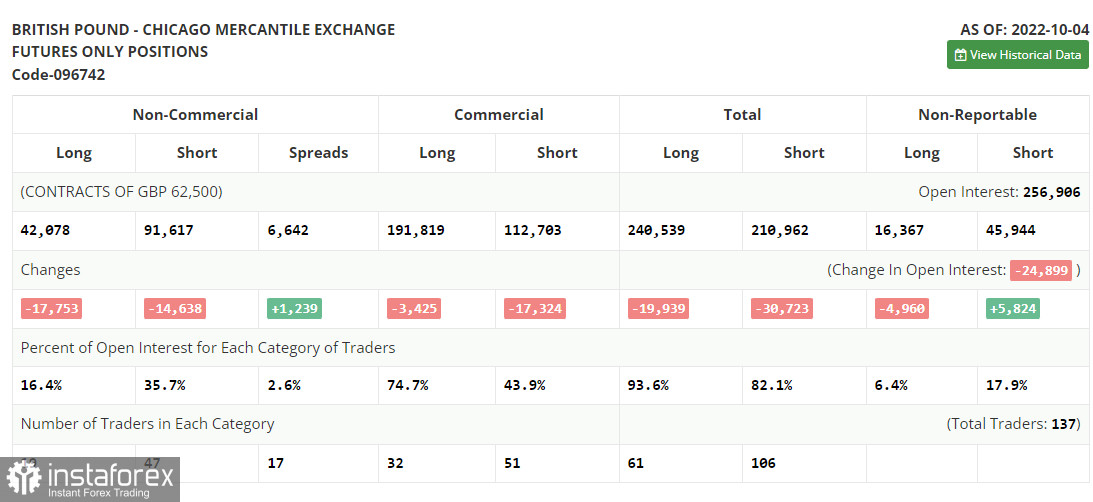
The Commitment of Traders (COT) report for October 4 logged a sharp decline in both long and short positions. The report has already recorded the fact that the pound fell by more than 10% in two days, and then its sharp recovery amid the Bank of England's intervention. Now, when the situation has stabilized a bit, it is clear that those who want to buy and sell the pound have significantly decreased. Given that the prospects for the British economy are deteriorating sharply and it is far from clear how the government is going to continue to deal with the cost-of-living crisis and high inflation - let me remind you that the last tax reduction plan failed; it is unlikely to expect further recovery of the pound. Activity in the UK private sector and in the service sector continues to decline, which also does not add confidence to investors. Much will depend on the Federal Reserve's policy, which is directly related to the US inflation report expected this week. For this reason, I do not bet on further growth of the pound in the current conditions and prefer the US dollar. The latest COT report indicates that long non-commercial positions decreased by 17,753, to the level of 42,078, while short non-commercial positions decreased by 14,638, to the level of 91,617, which led to a slight reduction in the negative value of the non-commercial net position to -49,539, against -46,424. The weekly closing price recovered and it was 1.1494 against 1.0738.

Indicator signals:
Trading is above the 30 and 50-day moving averages, which indicates that the bulls still have the advantage.
Moving averages
Note: The period and prices of moving averages are considered by the author on the H1 hourly chart and differs from the general definition of the classic daily moving averages on the daily D1 chart.
Bollinger Bands
In case of growth, the average border of the indicator around 1.1410 will act as resistance. In case of a decline, the area of 1.1215 will act as support.
Description of indicators
- Moving average (moving average, determines the current trend by smoothing out volatility and noise). Period 50. It is marked in yellow on the chart.
- Moving average (moving average, determines the current trend by smoothing out volatility and noise). Period 30. It is marked in green on the chart.
- MACD indicator (Moving Average Convergence/Divergence — convergence/divergence of moving averages) Quick EMA period 12. Slow EMA period to 26. SMA period 9
- Bollinger Bands (Bollinger Bands). Period 20
- Non-commercial speculative traders, such as individual traders, hedge funds, and large institutions that use the futures market for speculative purposes and meet certain requirements.
- Long non-commercial positions represent the total long open position of non-commercial traders.
- Short non-commercial positions represent the total short open position of non-commercial traders.
- Total non-commercial net position is the difference between short and long positions of non-commercial traders.


