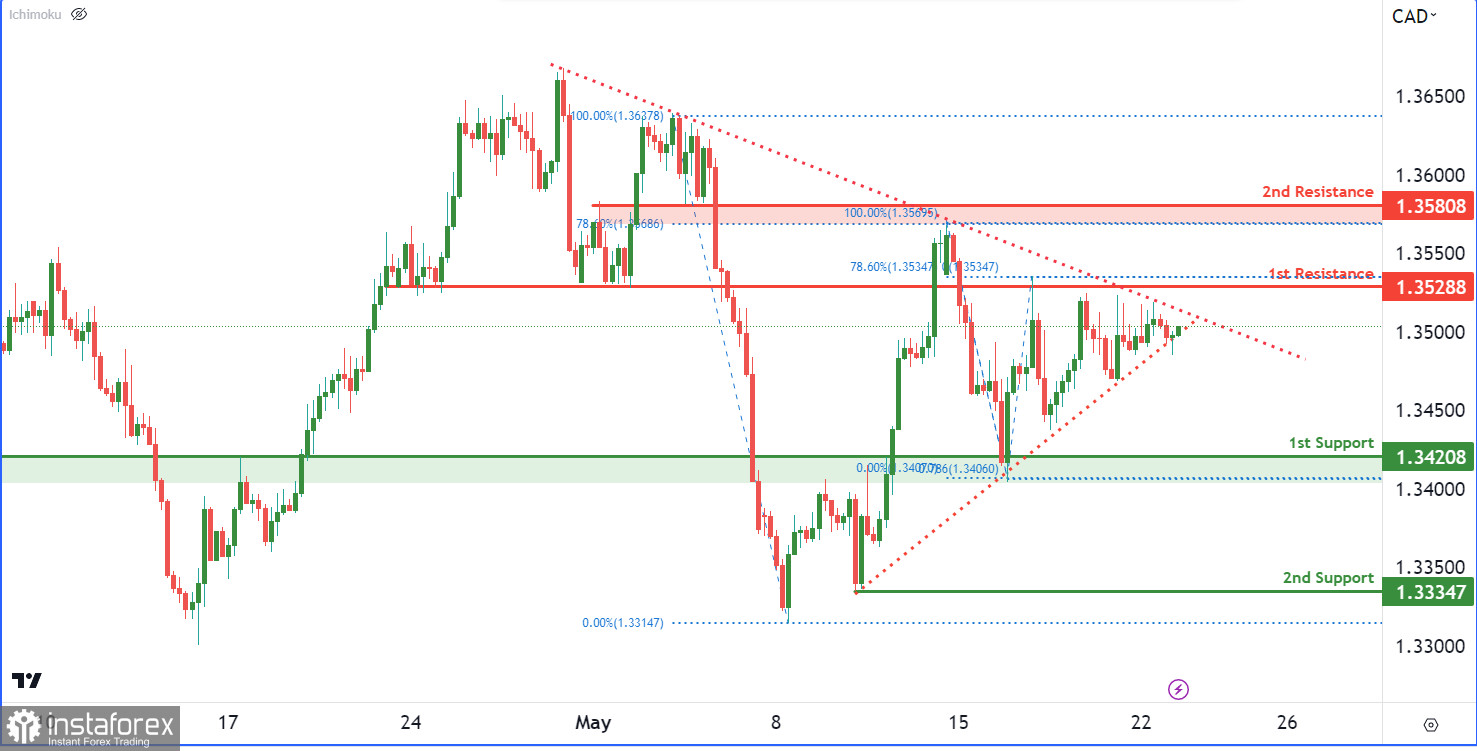
The USDCAD pair is currently displaying a neutral trend, with prices likely to oscillate between the first resistance and support levels. The first support, at 1.3420, is an overlap support, potentially serving as a halt to price decline. The second support is at 1.3334. If the price rises, the first resistance at 1.3528, an overlap resistance corresponding to the 78.6% Fibonacci retracement level, might serve as a significant hurdle. The second resistance, at 1.3580, is a swing high resistance, also aligning with the 78.6% Fibonacci retracement level, potentially indicating a price reversal. The chart exhibits a symmetrical triangle pattern, which implies a potential breakout or breakdown after the ongoing consolidation phase.


