Gold:

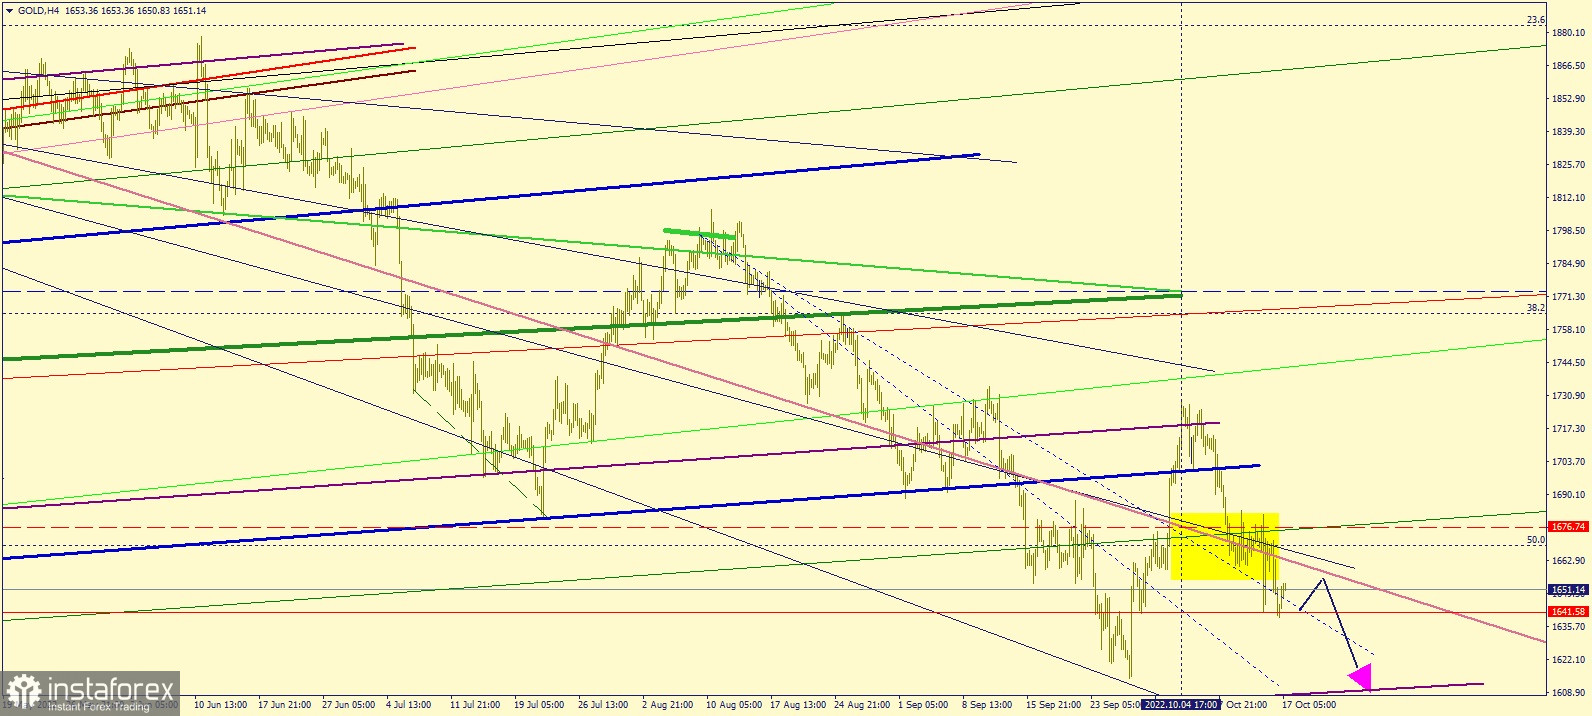
The chart shows the movement of #GOLD in the four-hour (H4) chart.
Gold has broken through several significant support levels on Friday (see the yellow area on the chart screen), so by the beginning of today's trading session, the move towards $1605-1590 appears to be inevitable.
Even so, there is still a possibility of decrease, as the support level of $1641.58 remains.
Therefore, the breakdown of $1592-1590 will push gold down to $1572.
The downtrend will end only when the key resistance level of $1676 broken.
Good luck!


