GBP/USD 5M

The GBP/USD currency pair corrected down quite a lot on Tuesday, but this "strength" was only due to the pair's high volatility, which has been observed in the past few weeks. The price remained above the lines of the Ichimoku indicator at the end of the day, which means that the upward movement may resume. If in the coming days the pound goes below these lines, then we can expect a new round of decline to the level of 1.0930. In general, the pound retains good growth prospects, as it is located above the critical line on the 24-hour time frame. At the same time, one should not forget about weak geopolitical and fundamental backgrounds. There will be few macroeconomic statistics this week, but in general, these two backgrounds continue to have a devastating effect on the pound. Take note that the pair has not yet managed to reach the last high - the level of 1.1486. Yesterday, there were no important events and reports in Great Britain, and there was only a report on industrial production in the United States, to which no market reaction followed.
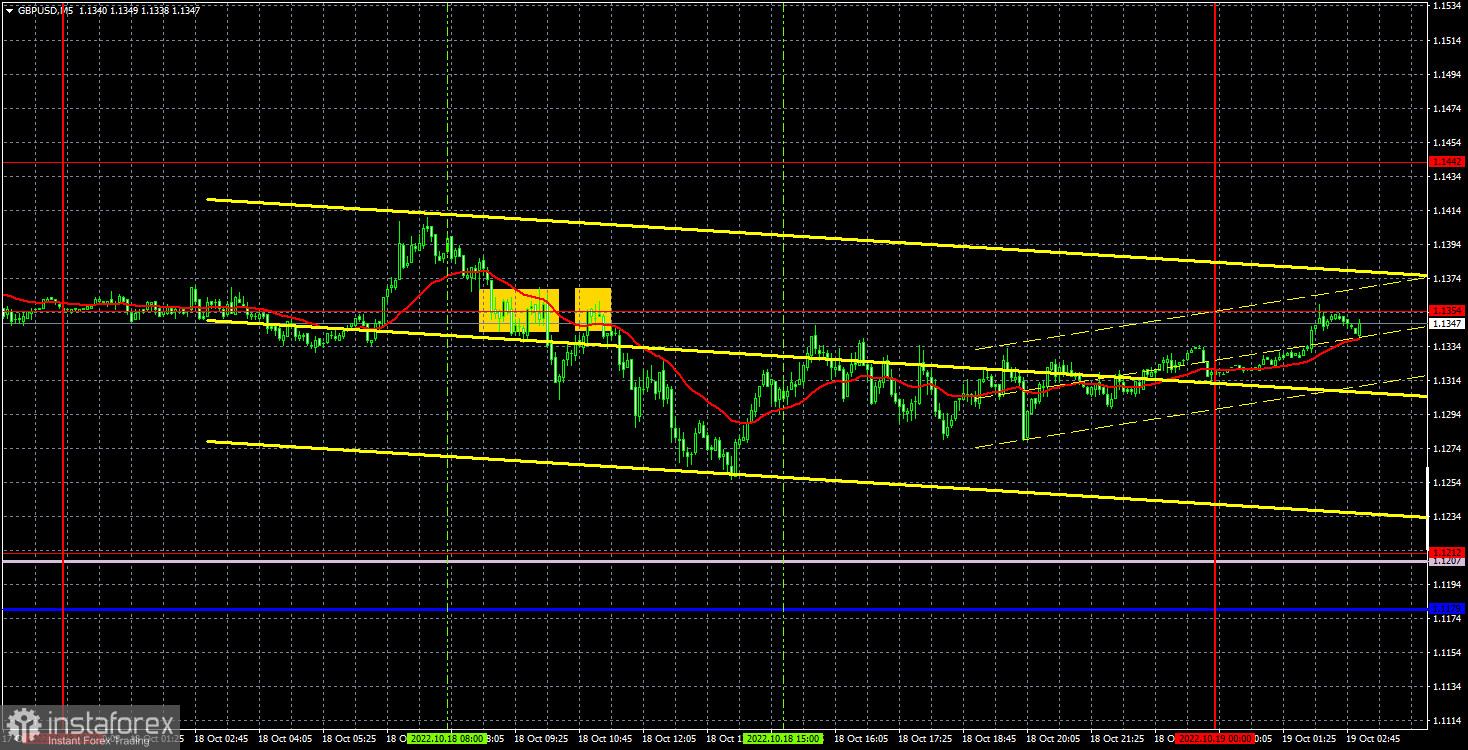
There were few trading signals on Tuesday, but this may be for the best, since the movement was still not the best during the day. Both sell signals formed near the level of 1.1354. The first short position was closed by Stop Loss at breakeven, the second position had to be closed manually. The price after the formation of the second signal did not reach the level of 1.1212, but did not return back to 1.1354 either. Consequently, the position had to be closed in the late afternoon on its own. Profit on it could be about 30 points.
COT report:

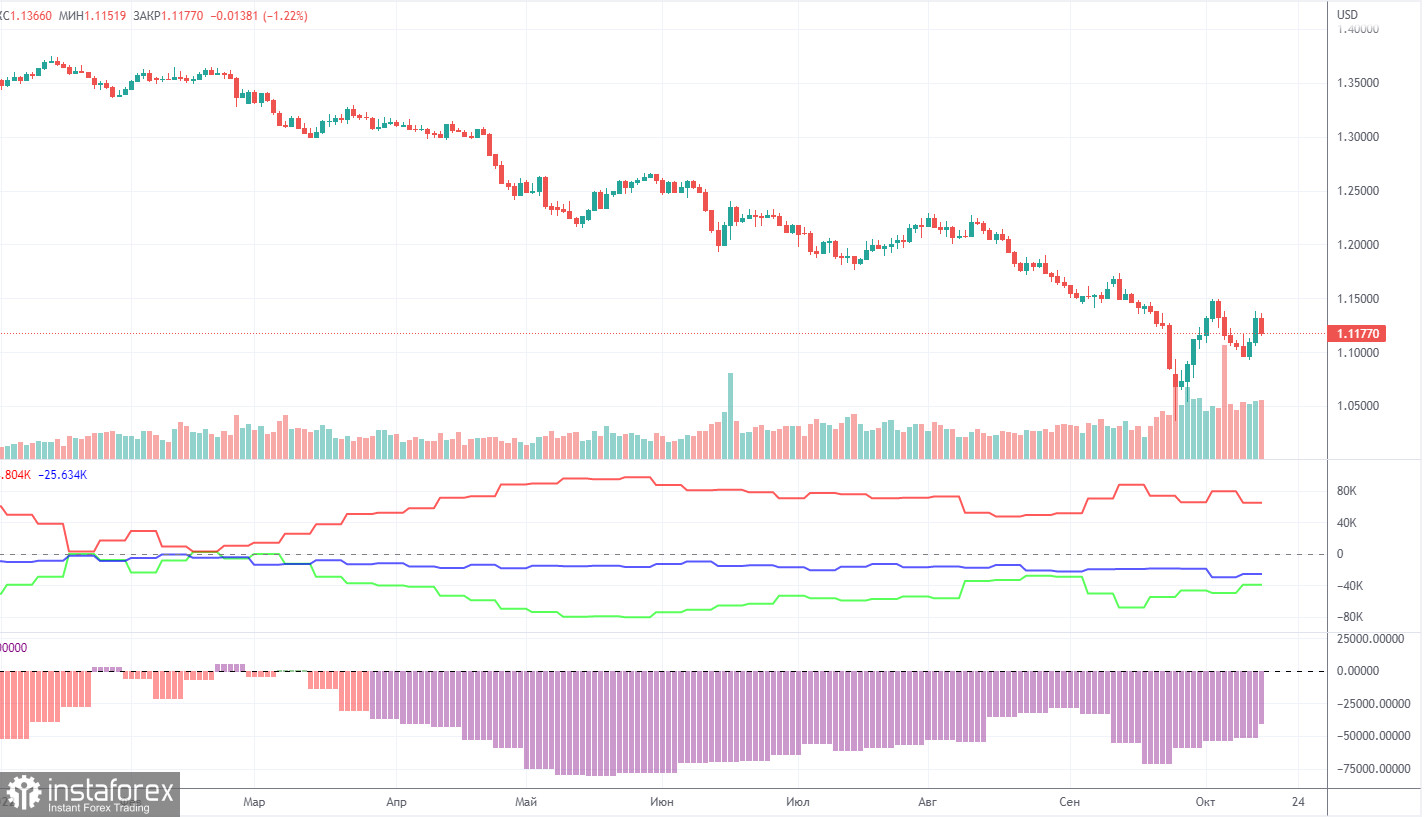
The latest Commitment of Traders (COT) report on the British pound showed a new weakening of the bearish mood. During the week, the non-commercial group opened 6,900 long positions and closed 3,400 short positions. Thus, the net position of non-commercial traders increased by 10,300, which is quite a lot for the pound. One might assume that the actions of the big players and the movement of the pound are finally starting to coincide, as the pound has generally gained over the last period of net growth, but we are worried that this may be another "false alarm". The net position indicator has been growing slightly in recent weeks, but this is not the first time it has risen, but the mood of the big players remains "pronounced bearish" and the pound continues to fall in the medium term. And, if we recall the situation with the euro, then there are big doubts that based on the COT reports, we can expect a strong growth from the pair. How can you count on it if the market buys the dollar more than the pound? The non-commercial group now has a total of 88,000 shorts and 49,000 longs open. The difference, as we see, is still very large. The euro cannot show growth if the major players are bullish, and the pound will suddenly be able to grow if the mood is bearish? We remain skeptical about the long-term growth of the British currency, although there are still certain technical reasons for this.
We recommend to familiarize yourself with:
Overview of the EUR/USD pair. October 19. Luis de Guindos believes that the euro/dollar pair will stabilize in the coming months.
Overview of the GBP/USD pair. October 19. Liz Truss will not voluntarily step down.
Forecast and trading signals for EUR/USD on October 19. Detailed analysis of the movement of the pair and trading transactions.
GBP/USD 1H

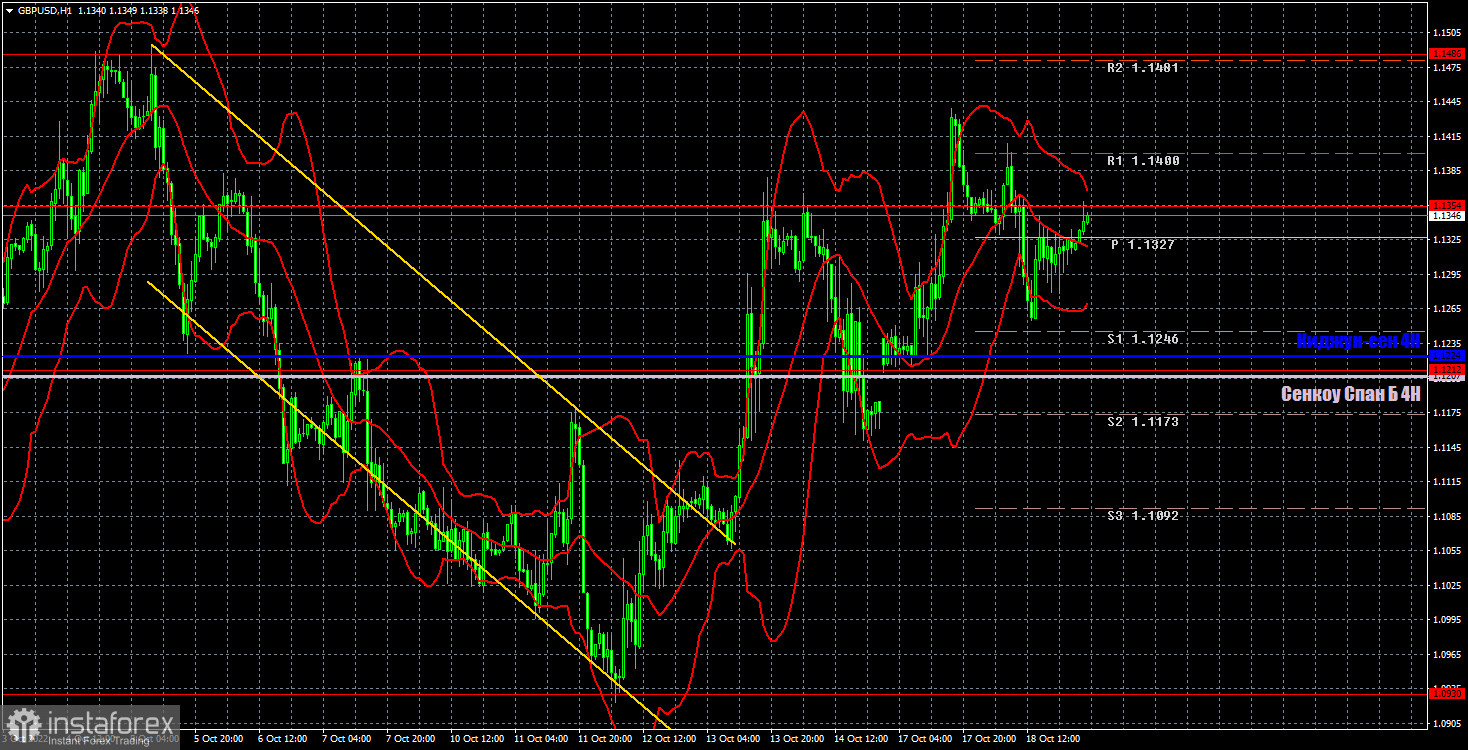
The pound/dollar pair is trying to develop an upward movement on the hourly timeframe, but so far it is not doing very well. No, the growth of the last 2-3 weeks is impressive, but it is more due to the previous collapse by the same value than the strength of the British pound. Despite the fact that the British currency has more chances than the euro, we believe that the global downward trend may resume its formation. For October 19, we highlight the following important levels: 1.0930, 1.1212, 1.1354, 1.1486, 1.1649. Senkou Span B (1.1207) and Kijun-sen (1.1224) lines can also be sources of signals. Signals can be "rebounds" and "breakthroughs" of these levels and lines. The Stop Loss level is recommended to be set to breakeven when the price passes in the right direction by 20 points. Ichimoku indicator lines can move during the day, which should be taken into account when determining trading signals. The chart also contains support and resistance levels that can be used to take profits on positions. The release of the inflation report is scheduled for Wednesday in the UK, which may provoke a strong market reaction. If it turns out that inflation is growing again, the reaction may be very strong. Recall that the reaction of the market to the latest report on US inflation was inadequate, that is, in different directions. Therefore, we do not undertake to predict the pair's movement after the release of British inflation.
Explanations for the chart:
Support and Resistance Levels are the levels that serve as targets when buying or selling the pair. You can place Take Profit near these levels.
Kijun-sen and Senkou Span B lines are lines of the Ichimoku indicator transferred to the hourly timeframe from the 4-hour one.
Support and resistance areas are areas from which the price has repeatedly rebounded off.
Yellow lines are trend lines, trend channels and any other technical patterns.
Indicator 1 on the COT charts is the size of the net position of each category of traders.
Indicator 2 on the COT charts is the size of the net position for the non-commercial group.


