


Analysis of Wednesday's deals:
30M chart of the GBP/USD pair
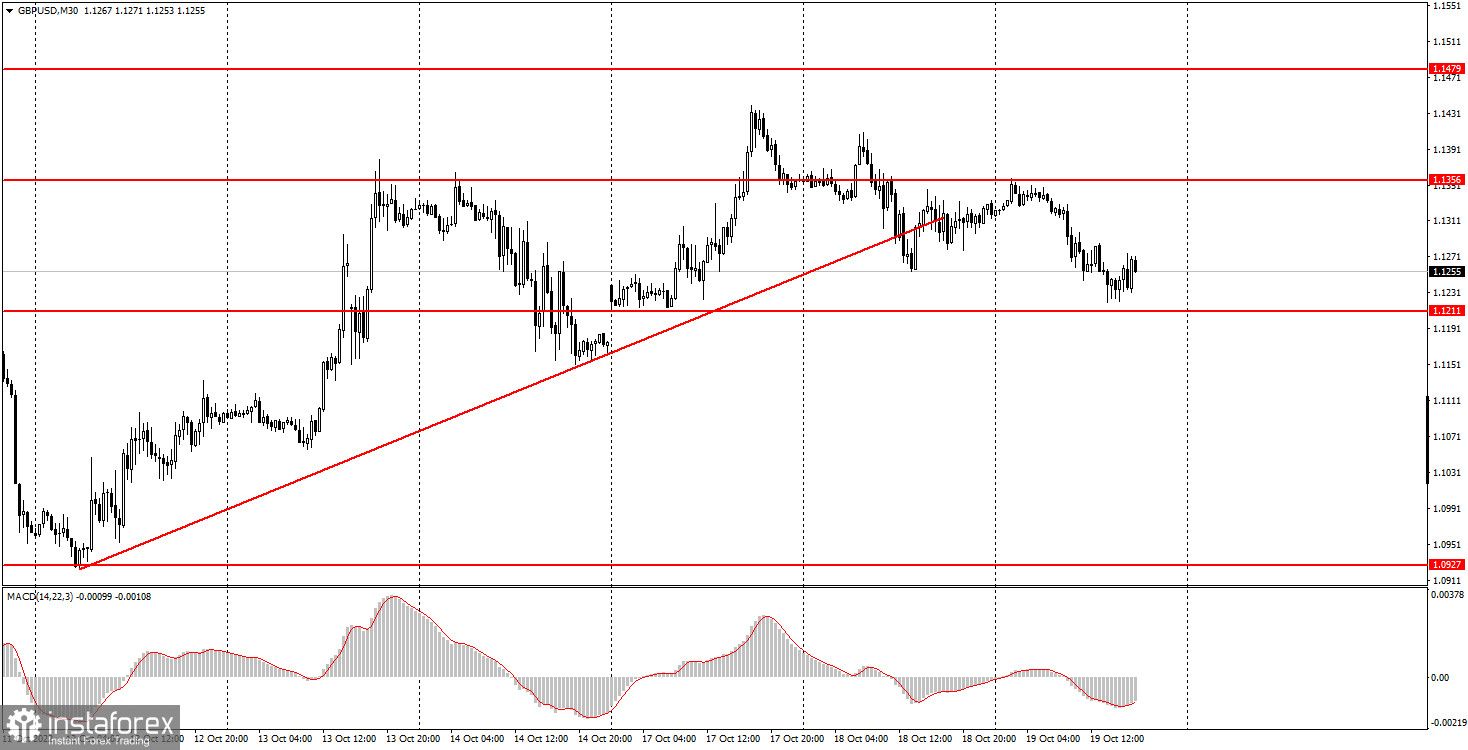
The GBP/USD pair also started a downward correction on Wednesday, and a day earlier it also overcame the ascending trend line. Thus, both pairs have broken their short-term upward trends and may now continue to fall. The UK inflation report was just published, which showed a new acceleration to the value of August - 10.1%. Recall that earlier official forecasts of the Bank of England spoke of a maximum inflation of 13-15%. We have no reason not to believe them. Of course, the British central bank has been raising the key rate at every meeting since the beginning of the year, which slightly slows down price growth, but, as we can see, it is still growing. Experts believe that the BoE rate will have to be raised to 5-6% in order for inflation to begin to decline. However, is the central bank capable of such a step? After all, a high rate not only extinguishes inflation, it also slows down the economy, which is already on the verge of recession... In general, in the case of the British pound, as usual, everything is bad. Certain chances for long-term growth remain, but for some reason they are melting every day. The pound's decline on Wednesday is not logical from a macroeconomic point of view, because a new increase in inflation means a potentially large increase in the BoE's rate at the next meeting. But this factor did not save the pound before, and even more so now...
5M chart of the GBP/USD pair
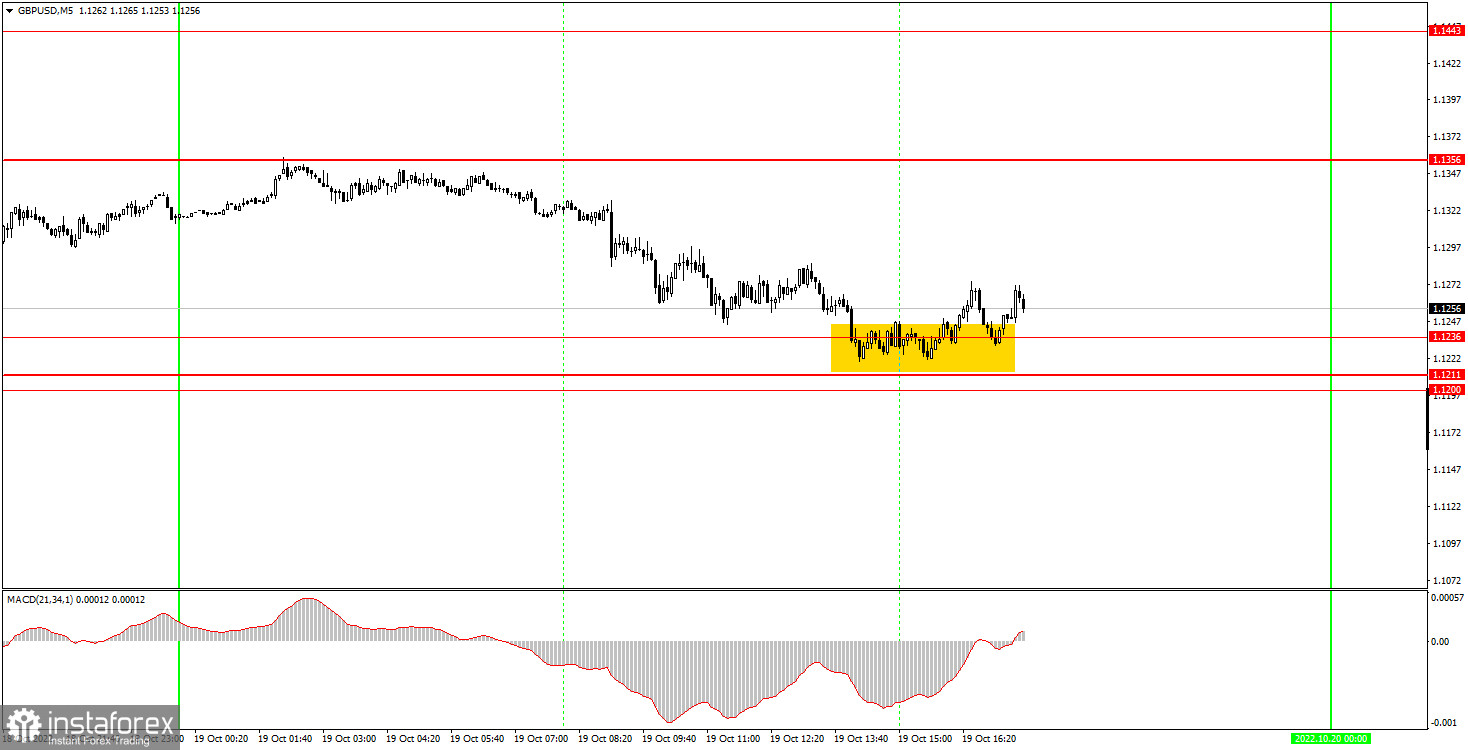
On the 5-minute timeframe, the pound has been moving in the same direction for almost the entire day, which is very good. Unfortunately, it was not possible to "catch" the beginning of the movement. The price has formed a sell signal, which could bring good profit to traders in the Asian trading session near the level of 1.1356. But at the European session, there was not a single signal. The first and only buy signal was formed already at the beginning of the US session near the level of 1.1236. The price bounced off the indicated level not too accurately and confidently, but beginners didn't manage to make much money on a long position. The price went up only 20-25 points at most. However, the position could have been closed at minimum profit in the late afternoon, which is better than nothing.
How to trade on Thursday:
The pound/dollar pair is trying to start a new downward trend on the 30-minute timeframe. The fact that the price has overcome the trend line already allows us to expect a new fall in the pound. And the fact that the euro also settled below the trend line only increases the likelihood of both risky currencies falling. On the 5-minute TF on Thursday it is recommended to trade at the levels 1.1024, 1.1200-1.1211-1.1236, 1.1356, 1.1443, 1.1479, 1.1550. When the price passes after opening a position in the right direction for 20 points, Stop Loss should be set to breakeven. The calendar of macroeconomic events is empty in the UK on Thursday. Meanwhile, only a secondary report on the number of applications for unemployment benefits will be released in the US, which in the current circumstances is not capable of causing any market reaction. The volatility of the pound remains high, but is declining over time. However, the pair does not stand still even on days when there are no news and reports.
Basic rules of the trading system:
1) The signal strength is calculated by the time it took to form the signal (bounce or overcome the level). The less time it took, the stronger the signal.
2) If two or more deals were opened near a certain level based on false signals (which did not trigger Take Profit or the nearest target level), then all subsequent signals from this level should be ignored.
3) In a flat, any pair can form a lot of false signals or not form them at all. But in any case, at the first signs of a flat, it is better to stop trading.
4) Trade deals are opened in the time period between the beginning of the European session and until the middle of the US one, when all deals must be closed manually.
5) On the 30-minute TF, using signals from the MACD indicator, you can trade only if there is good volatility and a trend, which is confirmed by a trend line or a trend channel.
6) If two levels are located too close to each other (from 5 to 15 points), then they should be considered as an area of support or resistance.
On the chart:
Support and Resistance Levels are the Levels that serve as targets when buying or selling the pair. You can place Take Profit near these levels.
Red lines are the channels or trend lines that display the current trend and show in which direction it is better to trade now.
The MACD indicator (14,22,3) consists of a histogram and a signal line. When they cross, this is a signal to enter the market. It is recommended to use this indicator in combination with trend lines (channels and trend lines).
Important speeches and reports (always contained in the news calendar) can greatly influence the movement of a currency pair. Therefore, during their exit, it is recommended to trade as carefully as possible or exit the market in order to avoid a sharp price reversal against the previous movement.
Beginners on Forex should remember that not every single trade has to be profitable. The development of a clear strategy and money management are the key to success in trading over a long period of time.


