


GBP/USD 5M
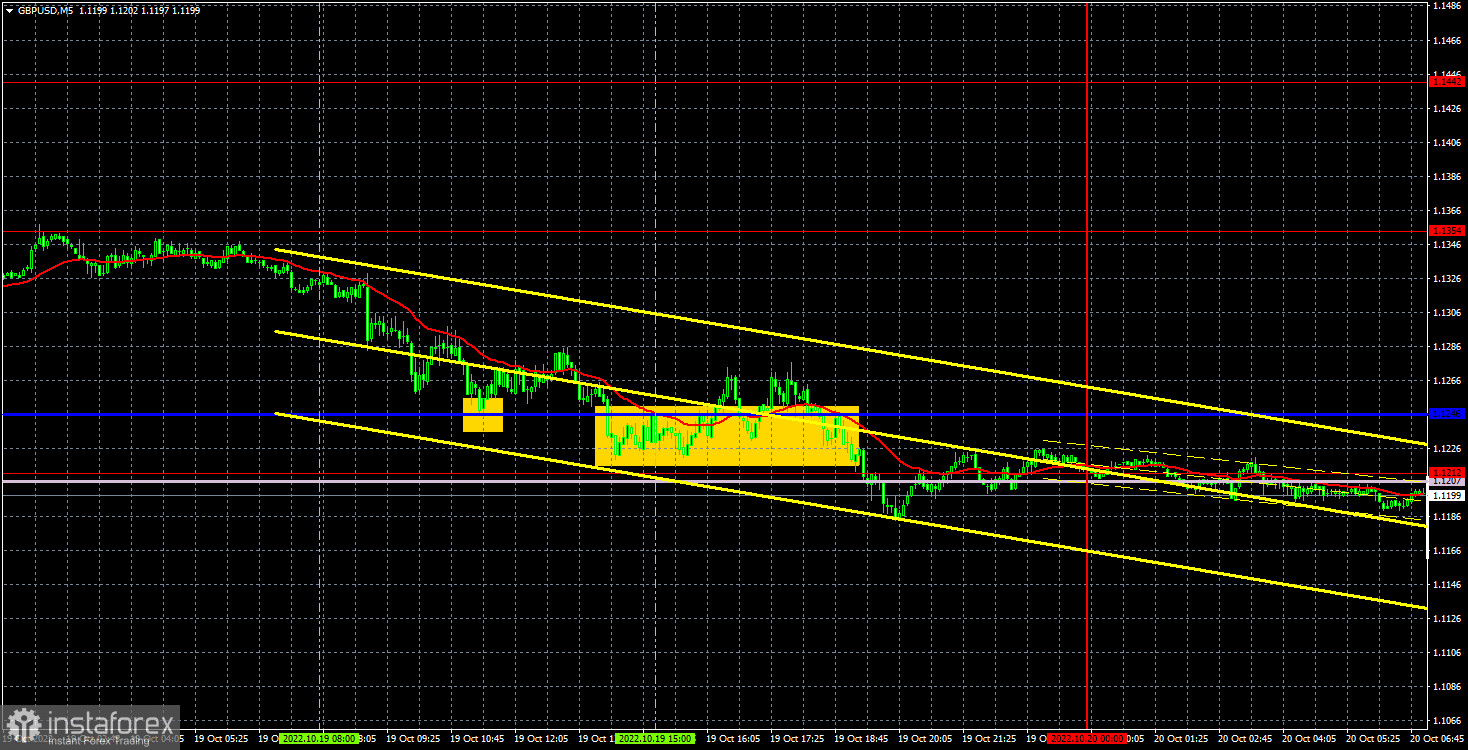
The GBP/USD currency pair continued to fall on Wednesday, although there were no special reasons for this. But we remember that the pair does not often stay in one place, especially the pound in recent weeks with its hyper volatility. The UK inflation report for September was published yesterday. The consumer price index rose to 10.1%, although a decrease of 0.2% y/y was recorded a month ago. As you can see, one decrease in inflation does not mean anything at all. The trend in this indicator remains upward, despite seven rate hikes by the Bank of England. Formally, the new rise in inflation was supposed to support the pound, as it means that the BoE will continue to raise the rate. However, traders are not interested in this moment at all. The pound fell due to the general fundamental, geopolitical and macroeconomic background. The British currency has grown enough over the past few weeks, the euro intends to fall again, so the bulls began to leave the market.
In regards to Wednesday's trading signals, the situation was sad. The first signal was formed almost at the very end of the daily movement near the critical line. A rebound from this line could have been worked out with a long position, but the price managed to go up only 22 points. Thanks to this traders were able to set Stop Loss to breakeven, at which the position was closed. There was also one or two bounces from the 1.1207-1.1246 area, but with the same success. Most likely, a small loss was received on the second transaction. Not the most positive day.
COT report:
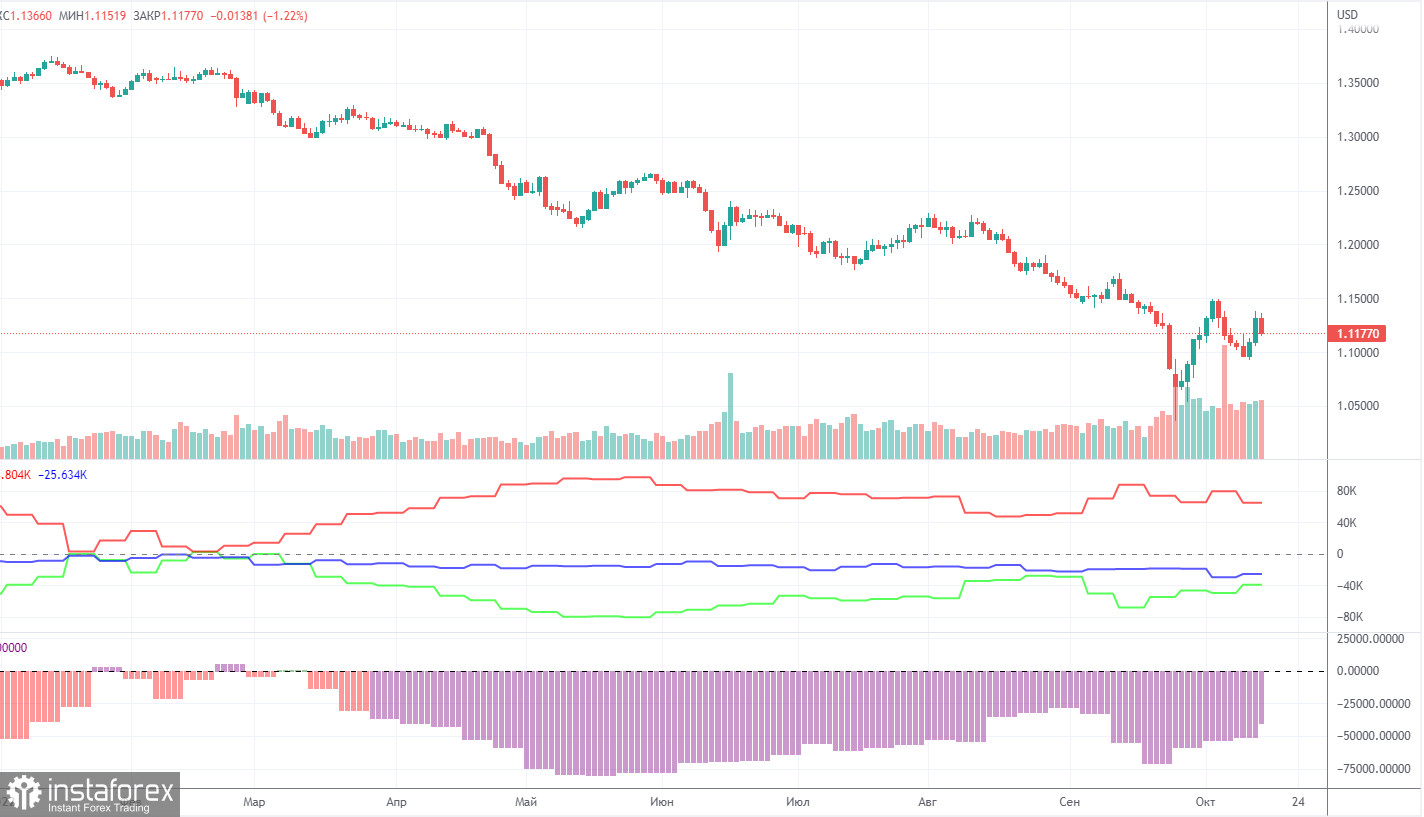
The latest Commitment of Traders (COT) report on the British pound showed a new weakening of the bearish mood. During the week, the non-commercial group opened 6,900 long positions and closed 3,400 short positions. Thus, the net position of non-commercial traders increased by 10,300, which is quite a lot for the pound. One might assume that the actions of the big players and the movement of the pound are finally starting to coincide, as the pound has generally gained over the last period of net growth, but we are worried that this may be another "false alarm". The net position indicator has been growing slightly in recent weeks, but this is not the first time it has risen, but the mood of the big players remains "pronounced bearish" and the pound continues to fall in the medium term. And, if we recall the situation with the euro, then there are big doubts that based on the COT reports, we can expect a strong growth from the pair. How can you count on it if the market buys the dollar more than the pound? The non-commercial group now has a total of 88,000 shorts and 49,000 longs open. The difference, as we see, is still very large. The euro cannot show growth if the major players are bullish, and the pound will suddenly be able to grow if the mood is bearish? We remain skeptical about the long-term growth of the British currency, although there are still certain technical reasons for this.
We recommend to familiarize yourself with:
Overview of the EUR/USD pair. October 20. The euro has ignored the inflation report and is preparing for a new fall.
Overview of the GBP/USD pair. October 20. The pound sterling is losing its winning pace. The new finance minister announced the cancellation of the tax cut plan.
Forecast and trading signals for EUR/USD on October 20. Detailed analysis of the movement of the pair and trading transactions.
GBP/USD 1H
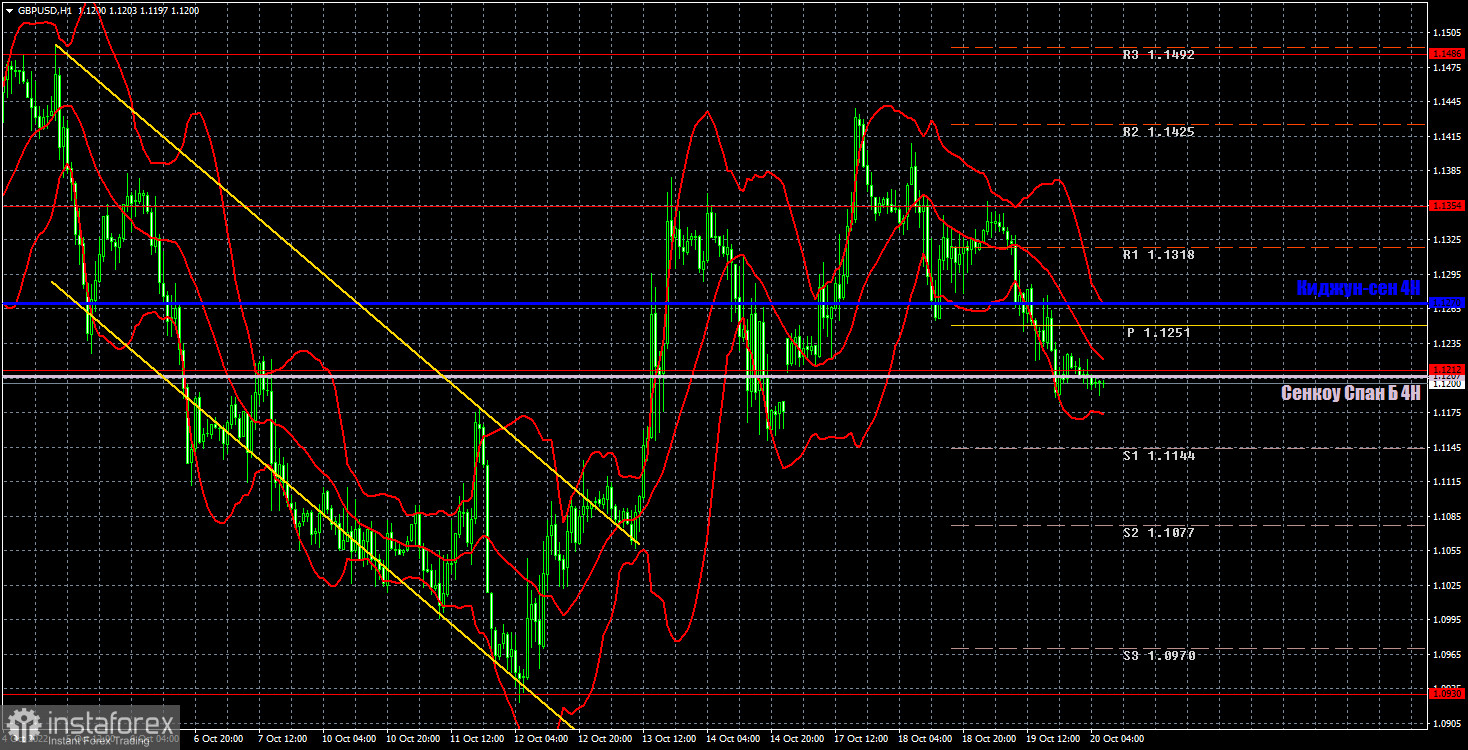
The pound/dollar pair has overcome the critical line on the hourly timeframe and may go below the Senkou Span B line in the coming hours. If this happens, then the chances for a new round of downward movement in the global plan will increase dramatically. A rebound from the lower border of the Ichimoku cloud may provoke a new growth for the pair. For October 20, we highlight the following important levels: 1.0930, 1.1212, 1.1354, 1.1486, 1.1649. Senkou Span B (1.1207) and Kijun-sen (1.1270) lines can also be sources of signals. Signals can be "rebounds" and "breakthroughs" of these levels and lines. The Stop Loss level is recommended to be set to breakeven when the price passes in the right direction by 20 points. Ichimoku indicator lines can move during the day, which should be taken into account when determining trading signals. The chart also contains support and resistance levels that can be used to take profits on positions. There are no major events or reports scheduled for Thursday in the UK and US. However, the pound continues to trade in a very volatile manner and does not stand still. Therefore, you can trade at least by levels and lines. You can make good money in case we witness a trend during the day.
Explanations for the chart:
Support and Resistance Levels are the levels that serve as targets when buying or selling the pair. You can place Take Profit near these levels.
Kijun-sen and Senkou Span B lines are lines of the Ichimoku indicator transferred to the hourly timeframe from the 4-hour one.
Support and resistance areas are areas from which the price has repeatedly rebounded off.
Yellow lines are trend lines, trend channels and any other technical patterns.
Indicator 1 on the COT charts is the size of the net position of each category of traders.
Indicator 2 on the COT charts is the size of the net position for the non-commercial group.


