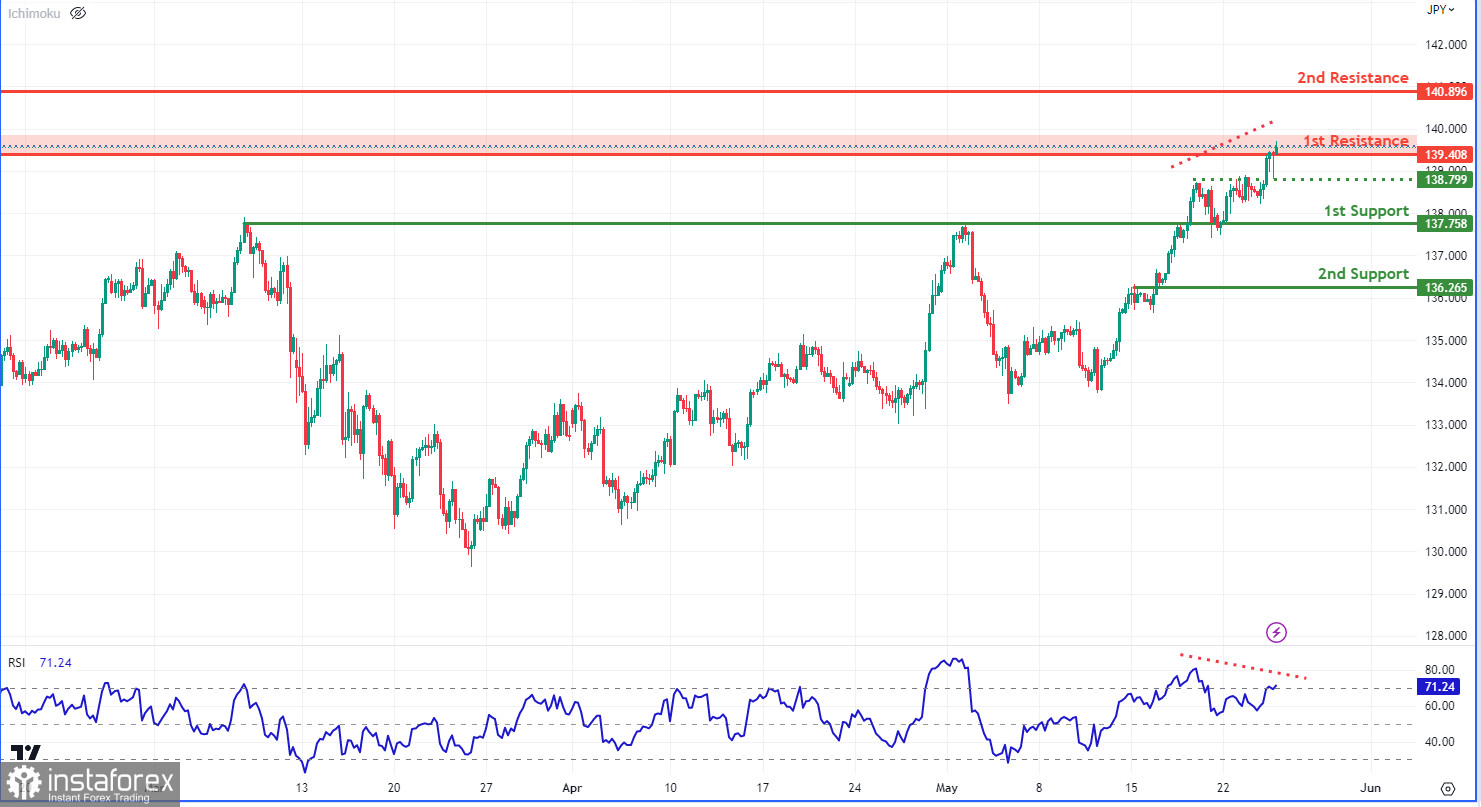
The USD/JPY chart is currently displaying a bearish trend, indicating possible continued declines. There could be a bearish reaction at the first resistance level of 139.40, which is a multi-swing high resistance and a 50% Fibonacci retracement, leading to a potential decrease towards the first support level of 137.75. There's an additional pullback resistance at 0.91 that could further challenge upward price movements. On the support side, the first support level at 137.75, an overlap support, could serve as a strong barrier against further price declines. A second overlap support at 136.26 and an intermediate pullback support at 138.79 could also offer support against price decreases. The Relative Strength Index (RSI) shows a bearish divergence, hinting at a possible upcoming reversal.