


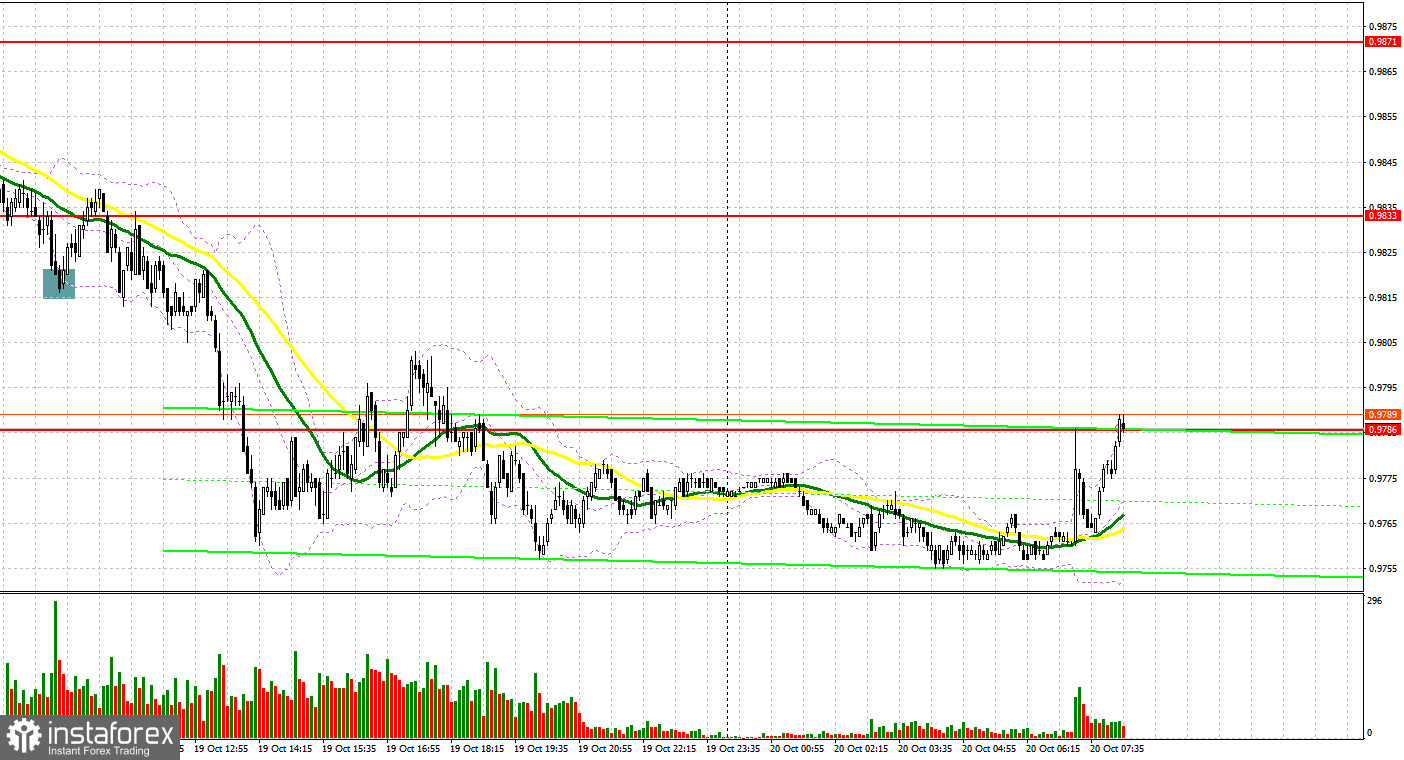
Yesterday, a single signal to enter the market was made. Let's take a look at the M5 chart to get a picture of what happened. In the morning review, I focused on 0.9824 and considered entering the market at this level. A fall and a false breakout after the release of inflation data in the eurozone, which came better than expected, produced a buy signal. However, following a 15-pip increase, the bulls felt less enthusiastic to extend the movement. In the North American session, the situation on the chart changed and no entry signals were generated.
When to go long on EUR/USD:
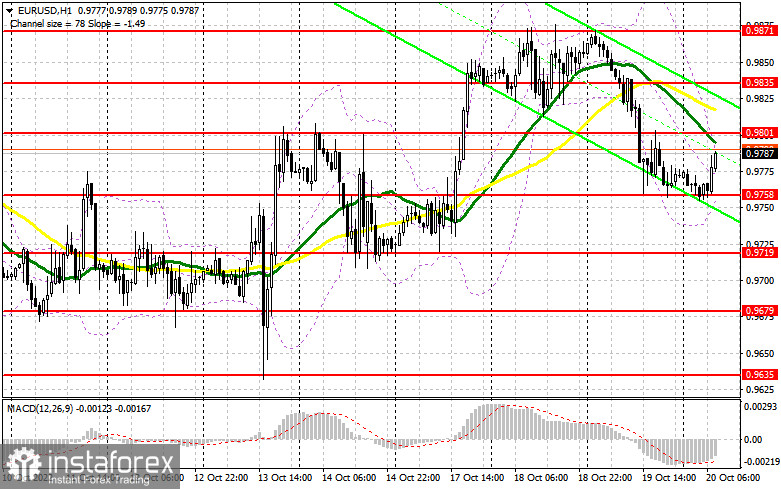
No important macro reports able to influence the euro are due in the European session. Therefore, the bulls should count only on themselves if they want to stabilize the situation. Germany's PPI may briefly exert pressure on the euro. The market will also have little interest in the EU leaders' summit. The bulls should protect the nearest support level of 0.9758 if they want the uptrend to extend. In case of a fall, a false breakout through this barrier would create a buy entry point with the target at 0.9801. Yesterday, the price failed to break above the level. The bulls would be able to regain control over the market should the quote break and test this range from top to bottom already in the North American session. Then, bearish stop orders would trigger and an additional buy signal would be made with the target at 0.9835, almost in line with bearish MAs. The uptrend that emerged on October 13 would get stronger. Breaking above 0.9835, the price would head towards 0.9871, where it would be wiser to lock in profits. Should EUR/USD go down when there is no trading activity at 0.9758, the bulls would lose control of the market, and pressure on the euro would increase. The descending price channel would continue to build up, and the price would fall to 0.9719. So, long positions could be considered after a false breakout through this level. EUR/USD could also be bought at 0.9679 or 0.9635 on a rebound, allowing a bullish correction of 30-35 pips intraday.
When to go short on EUR/USD:
The bears should break below 0.9758, which would ruin the bulls' strategy, following steady growth on October 17th. Moreover, they should protect 0.9801 resistance. The price could test the barrier already in the European session when Germany's September macro data comes. It would be wiser to go short after a false breakout through 0.9801. In such a case, the price would head towards the barrier 0.9758, formed yesterday. This would mark its fourth test of this mark. Consolidation and a bottom-top retest of the level would signal to continue selling EUR/USD with the target at 0.9719. This would also trigger a row of bullish stop orders. The most distant target stands at 0.9679 where it would be wiser to lock in profits. Should EUR/USD show growth in the European session when there is no bearish activity at 0.9801, demand for the pair would increase, which could trigger a stronger bullish correction. In such a case, the instrument could be sold after a false breakout through 0.9835 only. Short positions on EUR/USD could be opened at the 0.9871 high or at 0.9917, allowing a bearish correction of 30-35 pips.
Commitments of Traders:
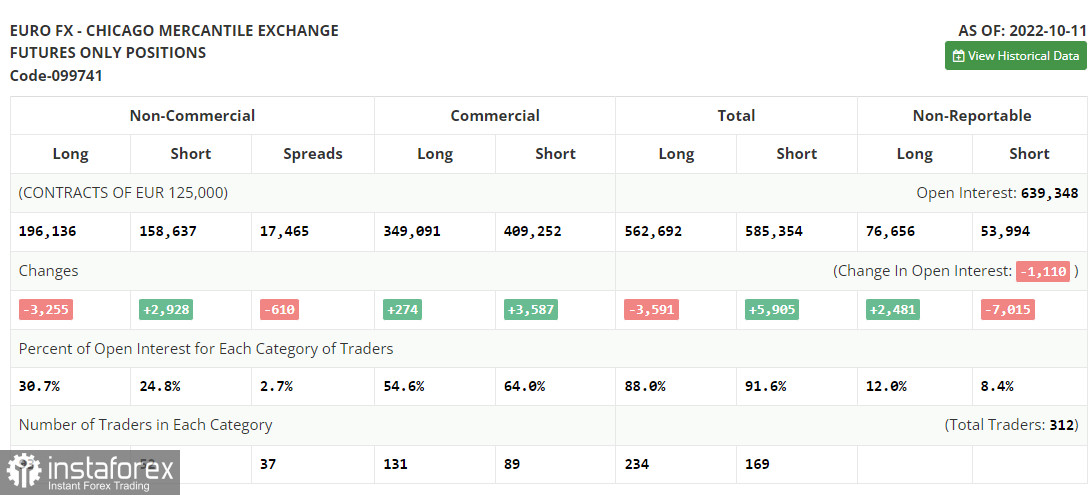
The COT report for October 11 logged a steep fall in long positions and a rise in short ones. It seems that traders were bracing themselves for the release of data on inflation and retail sales in the United States. Clearly, taming inflation has been a challenge for the Federal Reserve. As the September report shows, US inflation slowed just by 0.1% from the previous reading. In this light, the US regulator is likely to remain hawkish or become even more aggressive. Notably, it has been a while since the last mass sell-off of the euro below the parity level. In fact, such factors as geopolitical developments and the tightening cycle of the Federal Reserve are not enough to push the pair lower. Therefore, consider buying the euro in the medium term. According to the COT report, long non-commercial positions dropped by 3,255 to 196,136, while short non-commercial positions grew by 2,928 to 158,637. In a week, the total non-commercial net position remained positive and amounted to 37,499 versus 43,682. Investors use this as an opportunity to buy the cheaper euro below parity and accumulate long positions, hoping for the end of the crisis and the pair's recovery in the long run. The weekly closing price decreased to 0.9757 from 1.0053.
Indicator signals:
Moving averages
Trading is carried out below the 30-day and 50-day moving averages, showing the bulls attempting to gain control over the market.
Note: The period and prices of moving averages are viewed by the author on the hourly chart and differ from the general definition of classic daily moving averages on the daily chart.
Bollinger Bands
Resistance is seen at around 0.9800, in line with the upper band. Support stands at around 0.9755, in line with the lower band.
Indicator description:
- Moving average (MA) determines the current trend by smoothing volatility and noise. Period 50. Colored yellow on the chart.
- Moving average (MA) determines the current trend by smoothing volatility and noise. Period 30. Colored green on the chart.
- Moving Average Convergence/Divergence (MACD). Fast EMA 12. Slow EMA 26. SMA 9.
- Bollinger Bands. Period 20
- Non-commercial traders are speculators such as individual traders, hedge funds, and large institutions who use the futures market for speculative purposes and meet certain requirements.
- Long non-commercial positions are the total long position of non-commercial traders.
- Non-commercial short positions are the total short position of non-commercial traders.
- Total non-commercial net position is the difference between the short and long positions of non-commercial traders.


