


Trend analysis (Fig. 1).
The pound-dollar pair may move upward from the level of 1.1215 (closing of yesterday's daily candle) to the 1.1395 resistance level (thick blue line). If this level is tested, continued upward movement is possible with the target of 1.1533, the 85.4% retracement level (blue dotted line). Upon reaching this level, the price may roll back down.
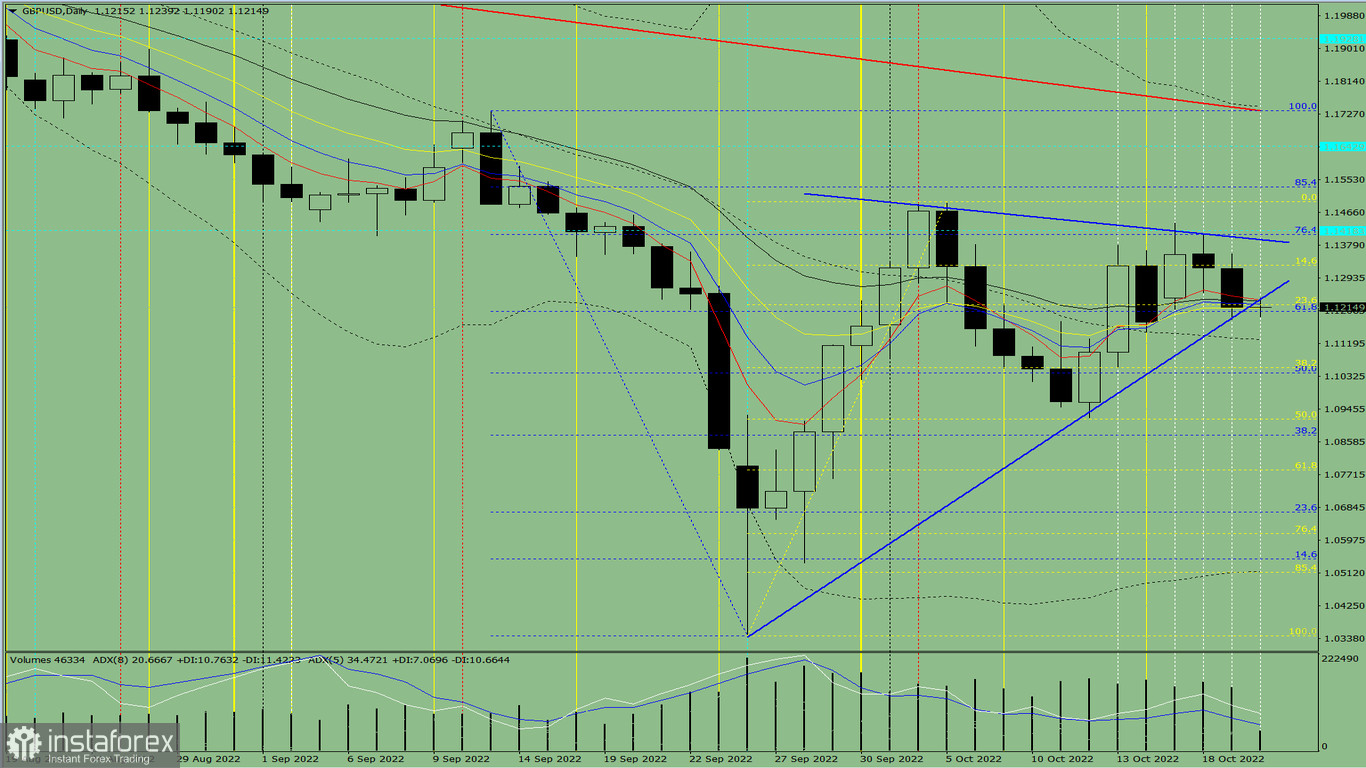
Fig. 1 (daily chart).
Comprehensive analysis:
- indicator analysis - up;
- Fibonacci levels - up;
- volumes - up;
- candlestick analysis - up;
- trend analysis - up;
- Bollinger bands - up;
- weekly chart - up.
General conclusion:
On Thursday, the price may move upward from the level of 1.1215 (closing of yesterday's daily candle) to the 1.1395 resistance level (thick blue line). If this level is tested, continued upward movement is possible with the target of 1.1533, the 85.4% retracement level (blue dotted line). Upon reaching this level, the price may roll back down.
Alternatively, the price may move upward from the level of 1.1215 (closing of yesterday's daily candle) to the 1.1395 resistance level (thick blue line). When testing this level, a downward movement is possible to 1.1221, the 23.6% retracement level (yellow dotted line). Upon reaching this level, the price may move up.


