Details of the economic calendar of October 20
Weekly data on jobless claims in the United States reflected a slight increase in the overall figure.
Statistics details:
The volume of continuing claims for benefits rose from 1.364 million to 1.385 million.
The volume of initial claims for benefits fell from 226,000 to 214,000.
What are they talking about in the media?
The main news of the past day is the statement of Liz Truss that she is leaving the post of Prime Minister of Great Britain. An interesting fact is that Truss's premiership was the shortest in British history, with only 45 days.
The reason for her resignation was the discontent and dissension caused by her radical program of tax cuts and increased spending. This plan drew a sea of criticism from all economic and political circles.
How does the market react to her departure?
The pound sterling slightly appreciated in value. There were no cardinal changes in the market due to vague prospects.
Analysis of trading charts from October 20
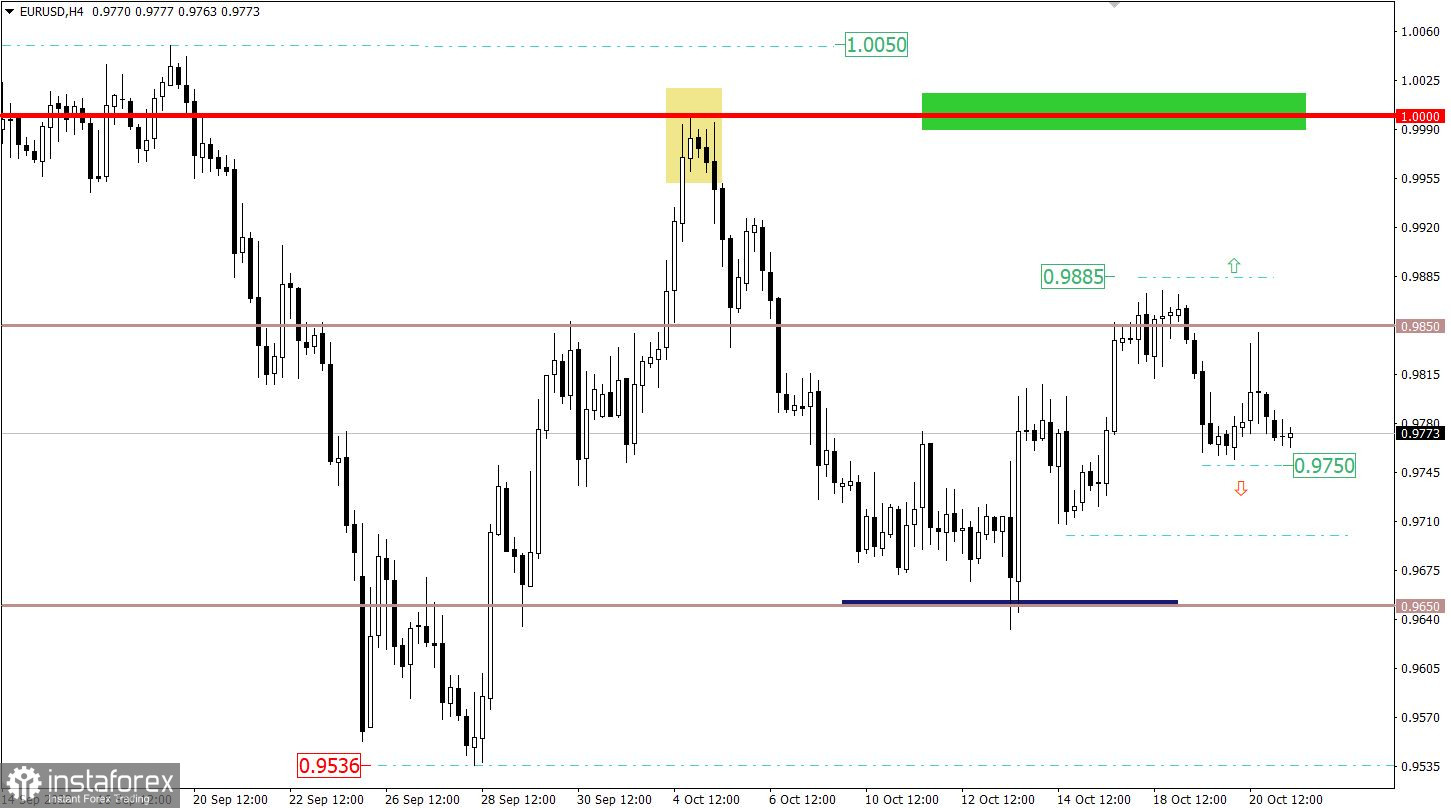
The EURUSD currency pair once again rebounded from the control value of 0.9850. As a result, the quote returned to where the trading day on Thursday began. The value of 0.9750 serves as a support.
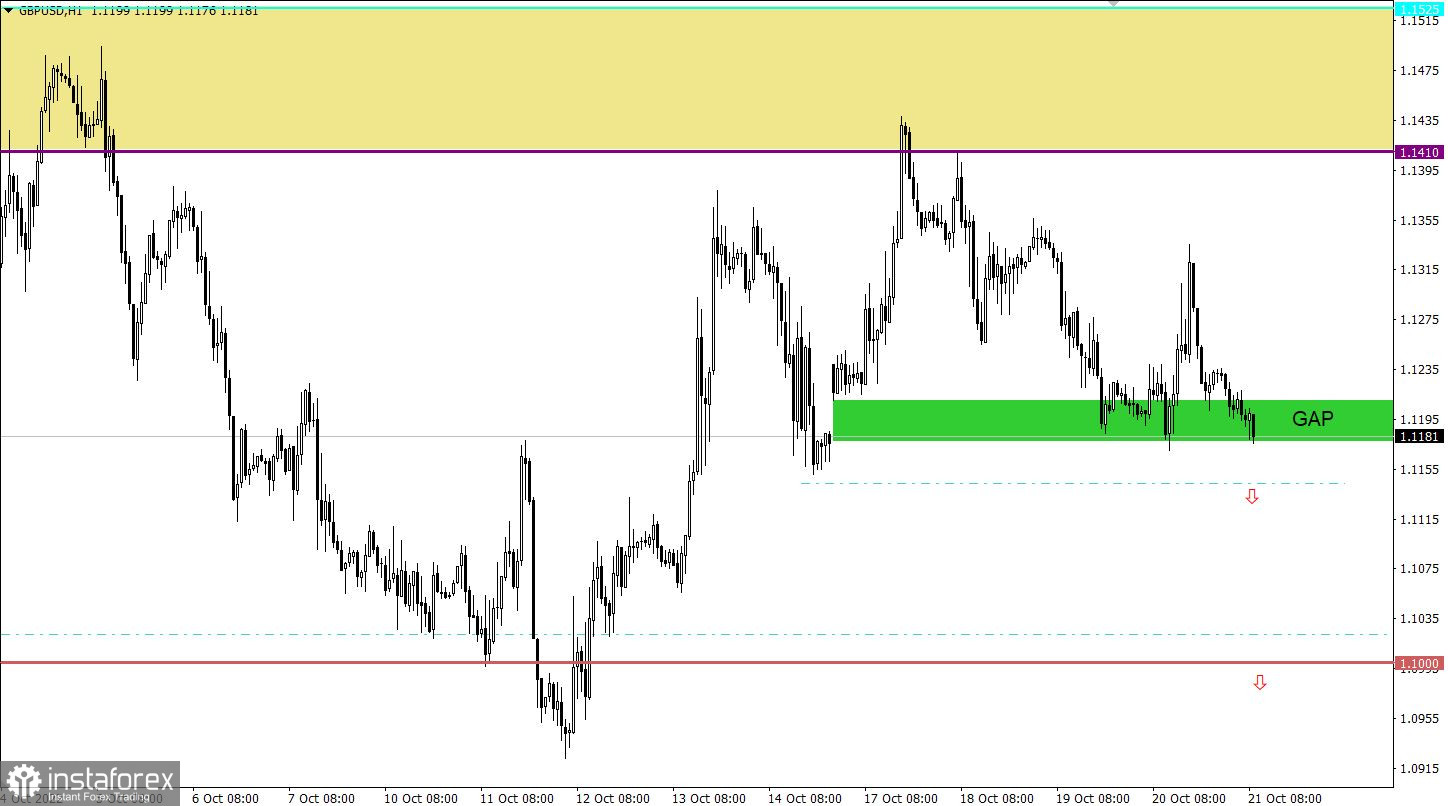
The GBPUSD currency pair, despite the impressive information flow, is moderately active. This suggests a characteristic uncertainty among market participants. As before, the value of 1.1150 serves as a support.

Economic calendar for October 21
At the opening of the European session, data on retail sales in the UK were published, which fell from -5.4% to -6.9%, with a forecast of -4.8%.
The reaction of the pound sterling to the negative statistics was appropriate—it continued to decline.
Trading plan for EUR/USD on October 21
In this situation, traders are guided by two main values at this stage—holding the price below 0.9750 in a downward scenario and 0.9885 in an upward market development.
It is worth noting that due to the strong information and news flow in the UK, market speculation may arise, where synchronous price jumps will occur through a positive correlation with the pound sterling.

Trading plan for GBP/USD on October 21
In this situation, keeping the price below 1.1150 will increase the chances of sellers for further decline in the direction of 1.1000. It is worth noting that the market is still in confusion. For this reason, chaotic price jumps are possible.

What is shown in the trading charts?
A candlestick chart view is graphical rectangles of white and black light, with sticks on top and bottom. When analyzing each candle in detail, you will see its characteristics of a relative period: the opening price, closing price, and maximum and minimum prices.
Horizontal levels are price coordinates, relative to which a stop or a price reversal may occur. These levels are called support and resistance in the market.
Circles and rectangles are highlighted examples where the price of the story unfolded. This color selection indicates horizontal lines that may put pressure on the quote in the future.
The up/down arrows are the reference points of the possible price direction in the future.


