


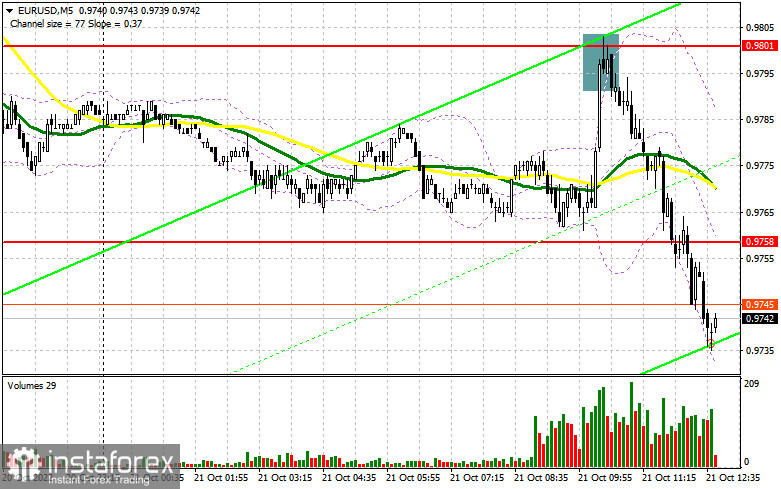
In my morning review, I outlined the level of 0.9801 and recommended entering the market from there. Let's have a look at the 5-minute chart. An upside movement towards this resistance level resulted in a false breakout and the formation of a sell signal. The pair slumped to 0.9758 and even slid below this range, thus generating a profit of 50 pips. The technical picture remained the same in the second half of the day but the trading strategy changed.
For long position on EUR/USD:
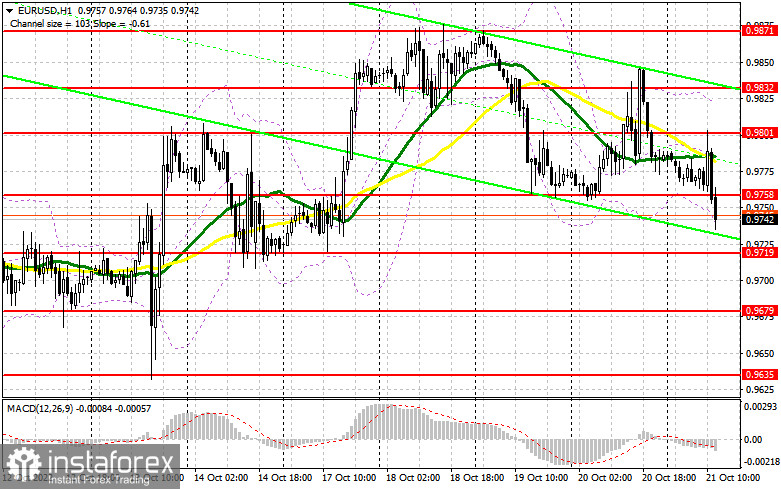
There are currently no drivers in the afternoon that could possibly boost demand for the US dollar. However, some reports issued in the EU may put more pressure on the euro. We are talking about the consumer confidence index in the eurozone which is set to decline again. If so, more bears will join the market which will deepen the fall of the pair. The statement by FOMC member John Williams is unlikely to influence the market sentiment although the latest speech by his colleagues suggests that the Fed may continue to pursue its super-aggressive monetary policy. If the pair declines further, new long positions can be added only after a false breakout of the nearest support at 0.9719. In this case, the upward target is seen at the resistance of 0.9758 formed in the first half of the day. Bulls will reclaim their control over the market only after breaking through this range and testing it from top to bottom which can happen in the New York session. However, this move is unlikely to change the current situation in the market but may return the price to the sideways channel that was formed later this week. Triggered stop-loss orders set by bears will create an additional signal to buy the pair with a possible rise to the 0.9801 area. This is where moving averages supporting the bearish trend are located. A break above 0.9801 will pave the way to the level of 0.9832 where I recommend profit taking. If EUR/USD falls and trading activity is low at 0.9758, bulls will completely lose control of the market and the euro will depreciate. This will result in the continued formation of the descending trend channel and a drop to 0.9719. The best moment to open buy positions will be a breakout of this level. It is recommended to buy EUR/USD right after a rebound only from 0.9679 or 0.9635, keeping in mind an upside intraday correction of 30-35 pips.
For short positions on EUR/USD:
Bears have successfully achieved all their goals and are now poised to head for the nearest support of 0.9717. But everything can go wrong at any moment. Therefore, I would recommend selling the pair in the second half of the day following a correction after a false breakout of 0.9758 and the failure to settle there. This will boost the confidence of large market players and will push the euro towards 0.9717. A firm hold above this range, as well as its upward retest, will validate more selling activity on the euro with the aim of triggering stop-loss orders set by the bulls and sending the price down to 0.9679. The level of 0.9635 will serve as the most distant target where I recommend profit taking. If EUR/USD rises in the course of the New York session and bears are idle at 0.9758, the pair is likely to finish the week within the sideways channel, very close to the opening level. If this is the case, I would recommend selling the pair only after the formation of a false breakout at 0.9801, similar to the one I described above. You can sell EUR/USD right after a rebound from the high of 0.9832 or higher at 0.9871, keeping in mind an upside intraday correction of 30-35 pips.
COT report
The Commitment of Traders report for October 11 showed a rapid fall in the number of long positions and a jump in the short ones. Obviously, traders braced for the inflation and retail sales reports in the US. The US Federal Reserve is struggling to combat stubbornly high inflation. The recent September report revealed that inflation slowed down by just 0.1% compared to the previous month. This means that the US central bank is very likely to maintain its aggressive monetary policy or even tighten it. At the same time, it is worth noting that traders stopped selling the euro below the parity level some time ago. Even the current geopolitical turmoil coupled with high interest rates is unlikely to push EUR/USD lower. So, this could be a good moment to consider buying the euro in the medium term. According to the COT report, the long positions of the non-commercial group of traders dropped by 3,255 to 196,136 while the short ones increased by 2,928 to 158,637. By the end of the week, the net non-commercial position remained positive at 37,499 against 43,682. This indicates that investors are benefiting from a cheaper euro and keep buying it while it is trading below parity. They might also be accumulating long positions as they hope that the pair will start to recover sooner or later. The weekly closing price declined to 0.9757 from 1.0053.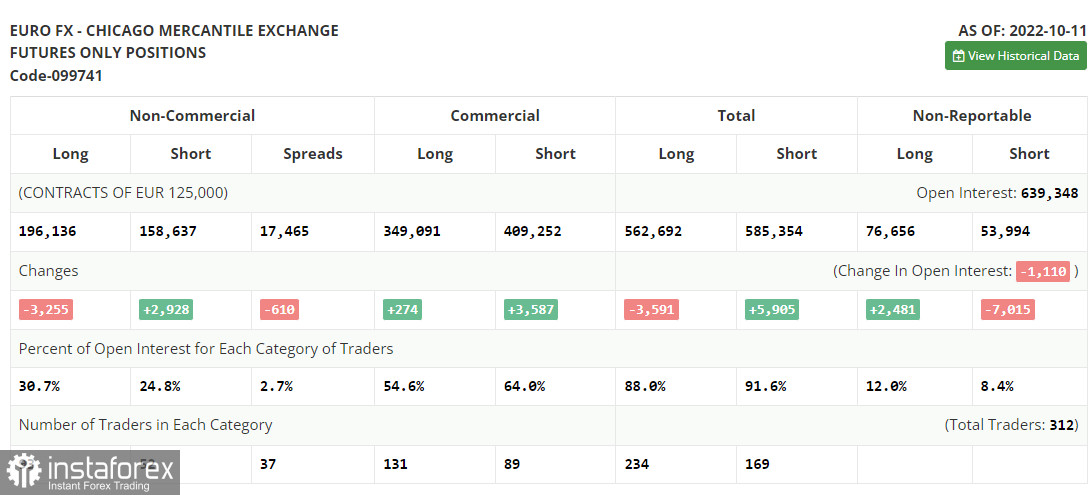
Indicator signals:
Moving Averages
Trading below the 30- and 50-day moving averages indicates the bear market.
Please note that the time period and levels of the moving averages are analyzed only for the H1 chart, which differs from the general definition of the classic daily moving averages on the D1 chart.
Bollinger Bands
In case of an upward movement, the upper band of the indicator at 0.9800 will serve as resistance.
Description of indicators:
• A moving average of a 50-day period determines the current trend by smoothing volatility and noise; marked in yellow on the chart;
• A moving average of a 30-day period determines the current trend by smoothing volatility and noise; marked in green on the chart;
• MACD Indicator (Moving Average Convergence/Divergence) Fast EMA with a 12-day period; Slow EMA with a 26-day period. SMA with a 9-day period;
• Bollinger Bands: 20-day period;
• Non-commercial traders are speculators such as individual traders, hedge funds, and large institutions who use the futures market for speculative purposes and meet certain requirements;
• Long non-commercial positions represent the total number of long positions opened by non-commercial traders;
• Short non-commercial positions represent the total number of short positions opened by non-commercial traders;
• The non-commercial net position is the difference between short and long positions of non-commercial traders.


