


Analysis of Friday's deals:
30M chart of the GBP/USD pair
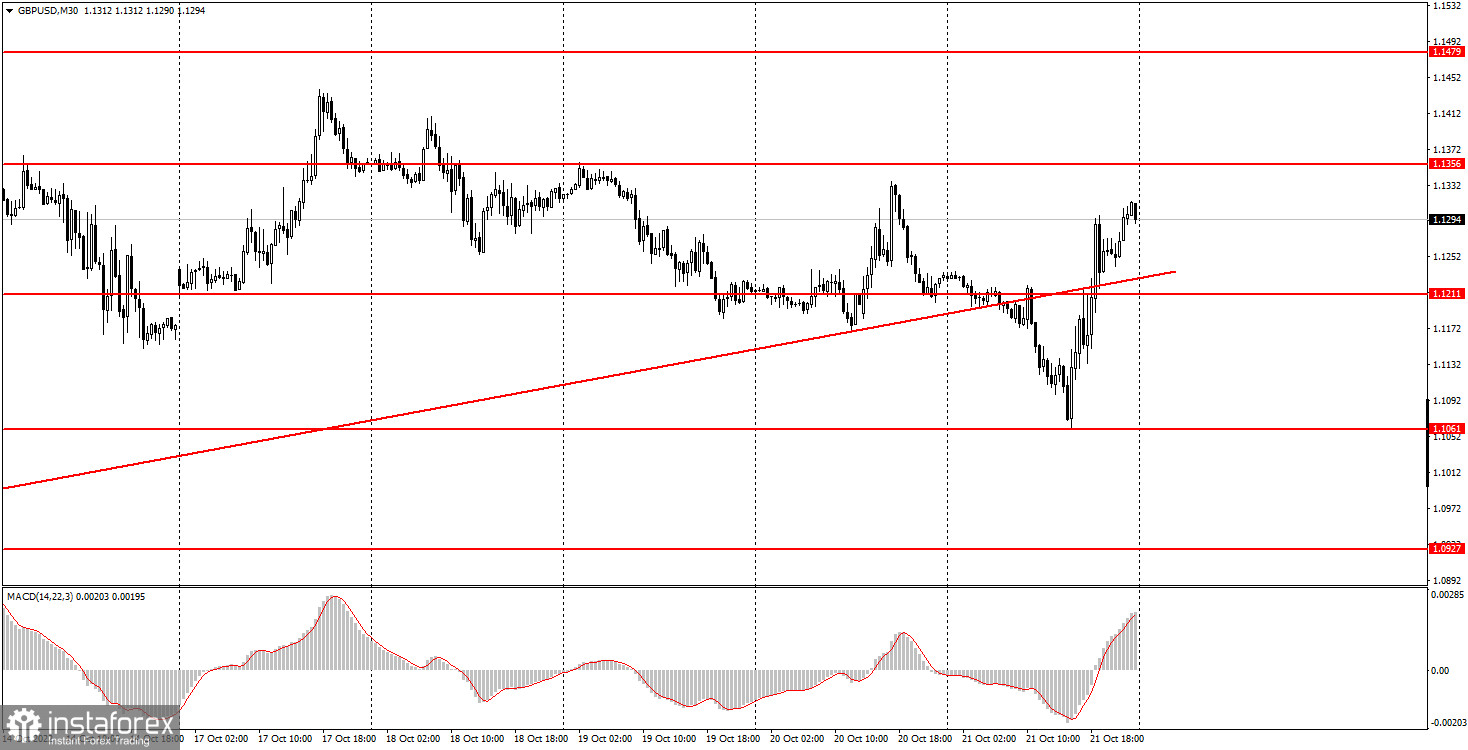
The GBP/USD pair managed to travel significant distances in both directions on Friday. In the morning, the price settled below the rising trend line and entirely made it clear that it was ready for a fall, in the afternoon it was already growing. Thus, the pound is now moving slightly better than the euro. In the morning, it had reason to show a decline, as the only report of the day - retail sales in the UK - turned out to be much worse than the forecasted values, which could have provoked a fall in the pound. True, at the same time, the euro was also falling, to which the report on British trade had nothing to do, so we believe that this report has nothing to do with it at all. Nevertheless, the market had a formal reason to sell. It's a mystery as to why we witnessed the pound rise by 250 points in the afternoon. On the one hand, the pound has been trading very volatile for several weeks now. And at such considerable distances it needs to go in some direction. There can't be high volatility and no intraday movement at the same time! On the other hand, the market may now remain in an agitated state due to another political crisis in the UK and an economic shock after Liz Truss's initiative to lower taxes, which led to collapses in financial markets.
5M chart of the GBP/USD pair
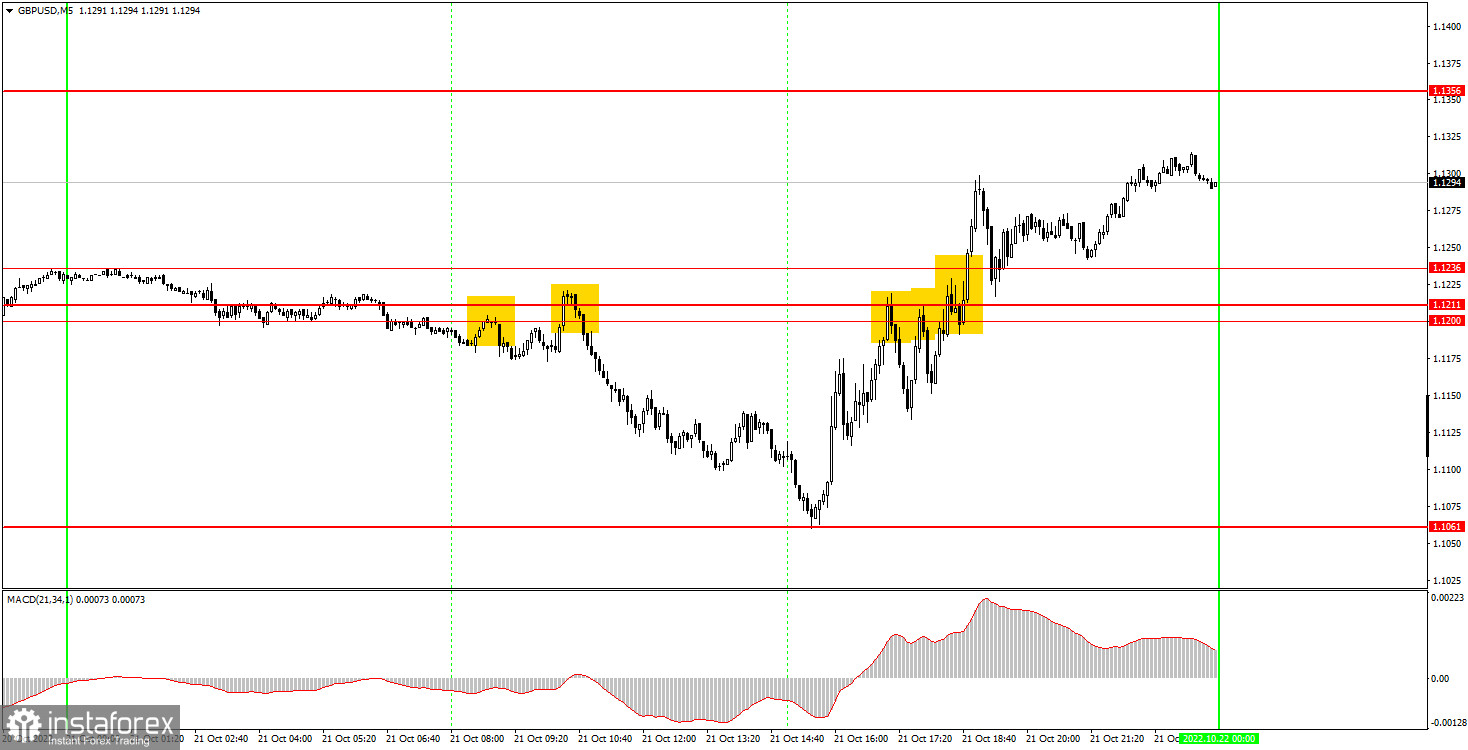
The nature of the pound's movement on the 5-minute timeframe on Friday is even better. Two sell signals in the morning in the form of rebounds from the 1.1200-1.1211 area provoked a drop of 120 points, and the price just barely managed to reach the target level of 1.1024. Since the distance between these benchmarks was almost 200 points, novice traders should have been immediately focused on manually closing positions. The 1.1061 level is a new one that formed instead of 1.1024. Then the price returned to the level of 1.1200 and rebounded from it again. This time it only passed 50 points down and the signal can be considered false. And this was already the second false signal near this area, so all subsequent signals should not have been worked out. The third short position was closed by Stop Loss at breakeven, just like the first one. As a result, beginners could earn 80-100 points on Friday.
How to trade on Monday:
The pound/dollar pair is trying to start a new downward trend on the 30-minute time frame, but so far it is trading more in different directions. It is not at all clear what to expect from the pound now, since the fundamental background is too strong and too diverse, it is very difficult to understand how the market will interpret and work it out. On the 5-minute TF tomorrow it is recommended to trade at the levels of 1.0927, 1.1061, 1.1200-1.1211-1.1236, 1.1356, 1.1443, 1.1479, 1.1550. When the price passes after opening a position in the right direction for 20 points, Stop Loss should be set to breakeven. The UK and the US are scheduled to publish indexes of business activity in the services and manufacturing sectors. These are not the most important indicators, but what difference does it make for the pound, if it can pass 250 points a day even without statistics?
Basic rules of the trading system:
1) The signal strength is calculated by the time it took to form the signal (bounce or overcome the level). The less time it took, the stronger the signal.
2) If two or more positions were opened near a certain level based on false signals (which did not trigger Take Profit or the nearest target level), then all subsequent signals from this level should be ignored.
3) In a flat, any pair can form a lot of false signals or not form them at all. But in any case, at the first signs of a flat, it is better to stop trading.
4) Positions are opened in the time period between the beginning of the European session and until the middle of the US one, when all positions must be closed manually.
5) On the 30-minute TF, using signals from the MACD indicator, you can trade only if there is good volatility and a trend, which is confirmed by a trend line or a trend channel.
6) If two levels are located too close to each other (from 5 to 15 points), then they should be considered as an area of support or resistance.
On the chart:
Support and Resistance Levels are the Levels that serve as targets when buying or selling the pair. You can place Take Profit near these levels.
Red lines are the channels or trend lines that display the current trend and show in which direction it is better to trade now.
The MACD indicator (14,22,3) consists of a histogram and a signal line. When they cross, this is a signal to enter the market. It is recommended to use this indicator in combination with trend lines (channels and trend lines).
Important speeches and reports (always contained in the news calendar) can greatly influence the movement of a currency pair. Therefore, during their exit, it is recommended to trade as carefully as possible or exit the market in order to avoid a sharp price reversal against the previous movement.
Beginners on Forex should remember that not every single trade has to be profitable. The development of a clear strategy and money management are the key to success in trading over a long period of time.


