GBP/USD 5M

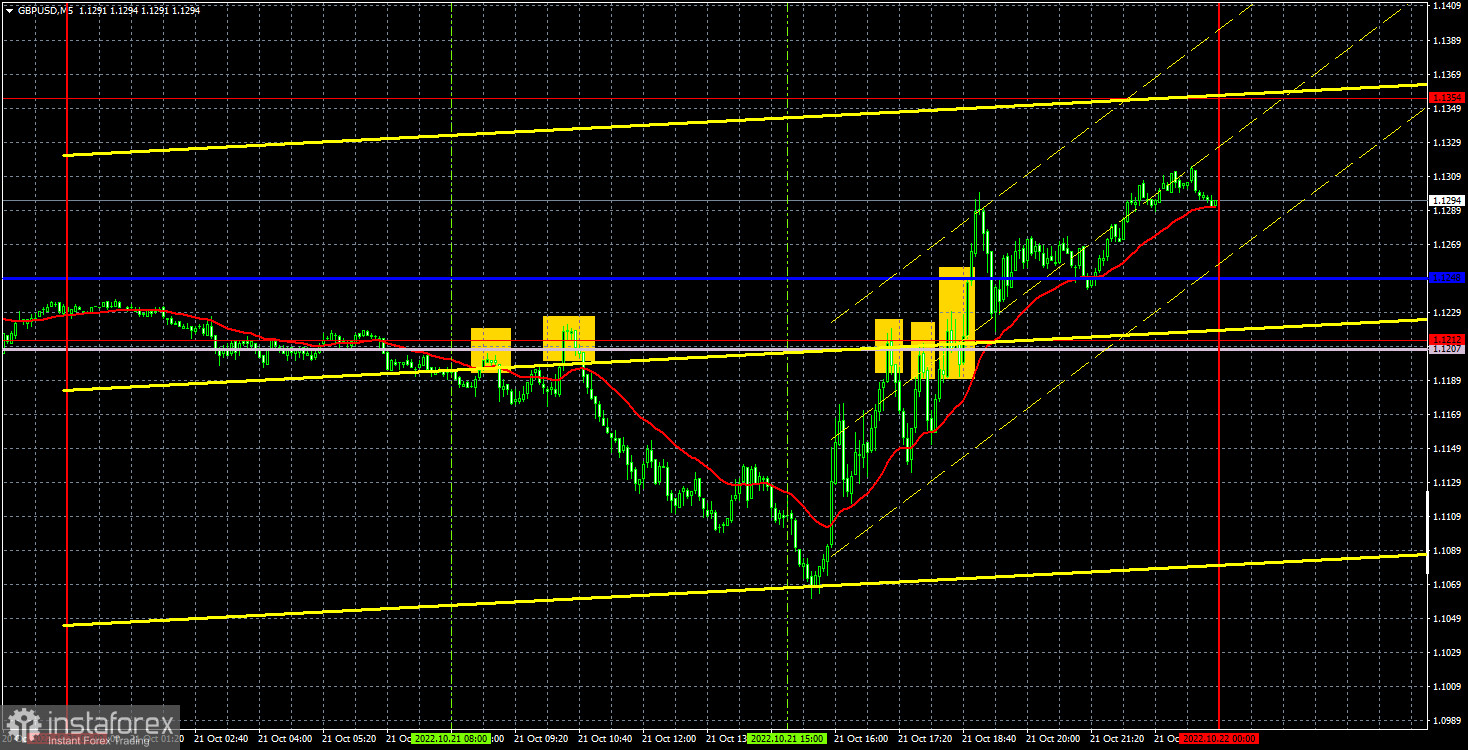
The GBP/USD currency pair also managed to thoroughly "fly" from side to side on Friday, as it did the day before. A rather strong decline in quotes began in the morning, which could be connected with the British statistics purely theoretically, because at the same time the euro was also falling. And an even stronger upward movement began in the US trading session, in which the pound added 260 points. We cannot conclude that this is how traders reacted to any news, because the movements during the day were multidirectional and not tied in time to any point. However, the apparently heightened volatility may indicate that the news of Liz Truss's resignation was received with a bang by the market. By the way, one cannot say that Truss's resignation is good news for the pound. Of course, we can assume that all its succeeding actions could be as disastrous as the "plan to save the economy." But still, this is unlikely, and in any case, traders managed to win back both the Truss initiative to reduce taxes, and the abolition of this plan, and the stabilization measures of the Bank of England. Truss may leave, but another Premier will come in her place and face the same economic problems.
In regards to Friday's trading signals, it was a little easier for the pound than the euro. The first sell signal turned out to be false and closed on Stop Loss at breakeven. The second sell signal was already correct, and the price moved in the right direction by 130 points. Unfortunately, it was too far from the target level, so the position should have been planned to be closed manually from the very beginning. Points 70-80 on it could be taken completely freely. This was followed by the third sell signal near the Senkou Span B line, which also turned out to be false, but also closed by Stop Loss. All subsequent signals near this line should have been ignored.
COT report:

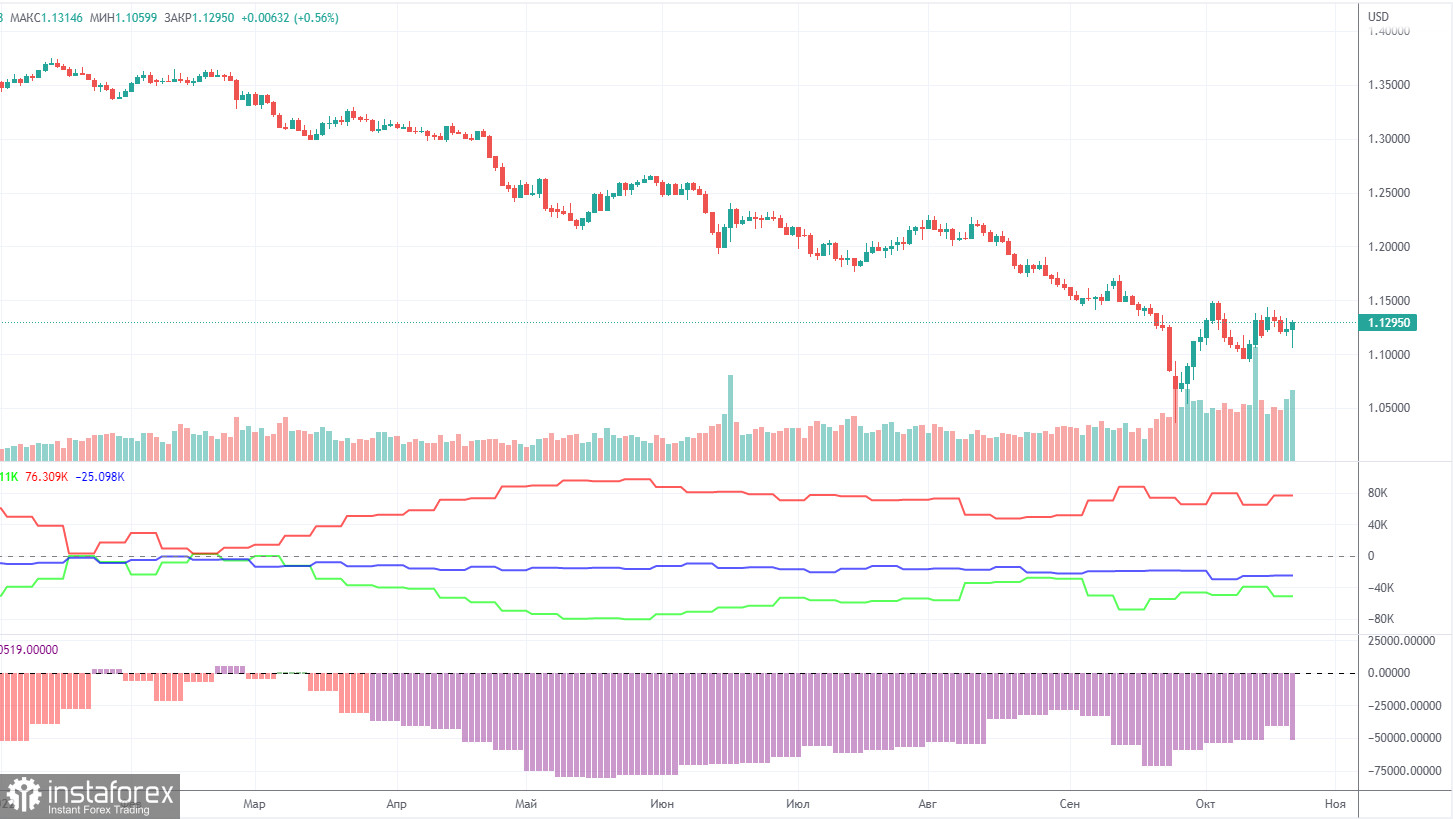
The latest Commitment of Traders (COT) report on the British pound showed a new growth in bearish sentiment. In the given period, the non-commercial group closed 8,600 long positions and opened 3,400 short positions. Thus, the net position of non-commercial traders fell by 12,900, which is quite a lot for the pound. The net position indicator has been growing slightly in recent weeks, but this is not the first time it has risen, but the mood of the big players remains "pronounced bearish" and the pound remains on a downward trend in the medium term. And, if we recall the situation with the euro, then there are big doubts that based on the COT reports, we can expect a strong growth from the pair. How can you count on it if the market buys the dollar more than the pound? The non-commercial group now has a total of 91,000 shorts and 40,000 longs open. The difference, as we see, is still very large. The euro cannot show growth if the major players are bullish, and the pound will suddenly be able to grow if the mood is bearish? As for the total number of open longs and shorts, here the bulls have an advantage of 25,000. But, as we can see, this indicator does not help the pound too much either. We remain skeptical about the long-term growth of the British currency, although there are still certain technical reasons for this.
We recommend to familiarize yourself with:
Overview of the EUR/USD pair. October 24. ECB meeting: how much will the central bank raise the rate?
Overview of the GBP/USD pair. October 24. This week - the election of the prime minister in the UK!
Forecast and trading signals for EUR/USD on October 24. Detailed analysis of the movement of the pair and trading transactions.
GBP/USD 1H

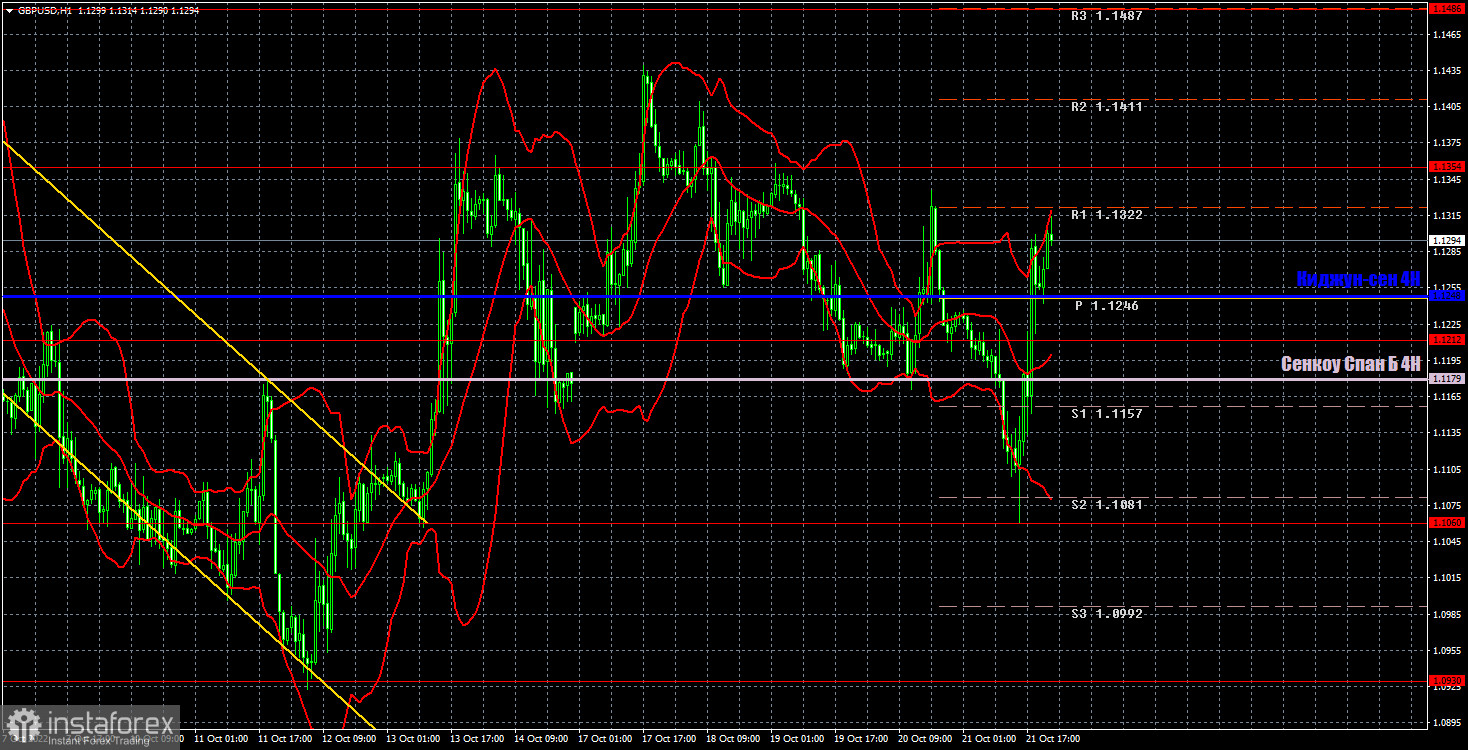
The pound/dollar pair is trading very volatile and very inadequately on the hourly timeframe. The price often changes direction and travels impressive distances in each. The lines of the Ichimoku indicator are also ignored, which speaks of the same "swing". On Monday, trading could be performed at the following levels: 1.0930, 1.1060, 1.1212, 1.1354, 1.1486, 1.1649. Senkou Span B (1.1179) and Kijun-sen (1.1248) lines can also be sources of signals. Signals can be bounces and breakouts of these levels and lines. The Stop Loss level is recommended to be set to breakeven when the price passes in the right direction by 20 points. Ichimoku indicator lines can move during the day, which should be taken into account when determining trading signals. The chart also contains support and resistance levels that can be used to take profits on positions. The UK and the US are set to release reports on business activity in the services and manufacturing sectors. The reaction of traders to them may follow in case of a strong deviation from the forecast values. And the pound now, in principle, does not really need statistics in order to trade volatilely. Plus, the election of a new British prime minister will take place this week, which could add even more volatility.
What we see on the trading charts:
Price levels of support and resistance are thick red lines, near which the movement may end. They do not provide trading signals.
The Kijun-sen and Senkou Span B lines are the lines of the Ichimoku indicator, moved to the one-hour chart from the 4-hour one. They are strong lines.
Extreme levels are thin red lines from which the price bounced earlier. They provide trading signals.
Yellow lines are trend lines, trend channels, and any other technical patterns.
Indicator 1 on the COT charts reflects the net position size of each category of traders.
Indicator 2 on the COT charts reflects the net position size for the non-commercial group.


