


Details of the economic calendar of October 21
UK retail sales data showed an acceleration in the pace of decline from -5.4% to -6.9%, with expectations at -4.8%.
The reaction of the pound sterling to the negative statistics was appropriate; it continued to decline.
What are they talking about in the media?
The Wall Street Journal published an article at the close of the European session, which said that during the November meeting of the Fed, there may well be hints about a future pause in raising interest rates.
On this, the market played a sell-off of dollar positions.
Friday's key event was another currency intervention in USDJPY, which provoked a collapse of the dollar index by 1.5%. This step supported risky assets, at the same time stimulated dollar sellers.
Analysis of trading charts from October 21
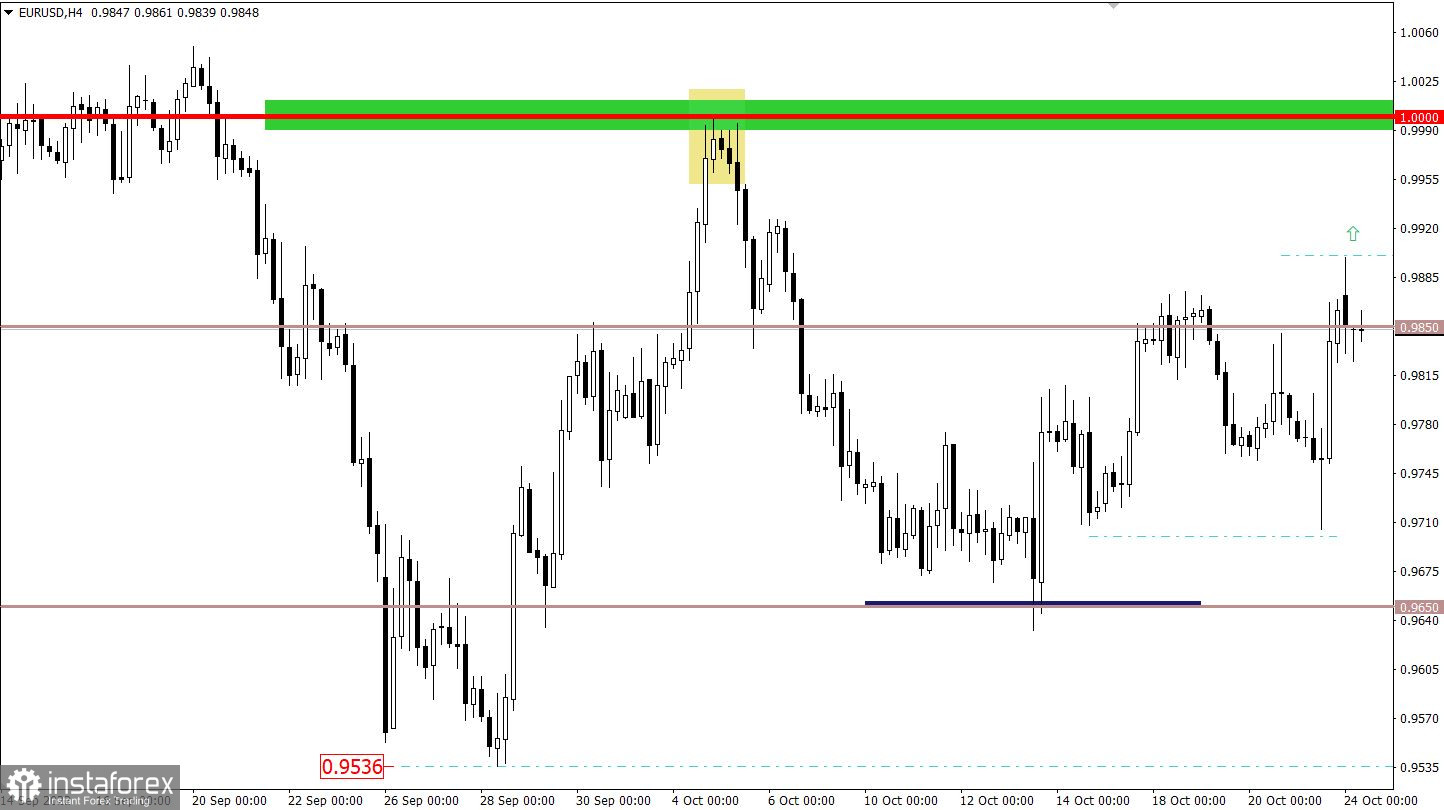
The EURUSD currency pair returned to the intermediate level of 0.9850 during the impulse price jump, locally overcoming it.
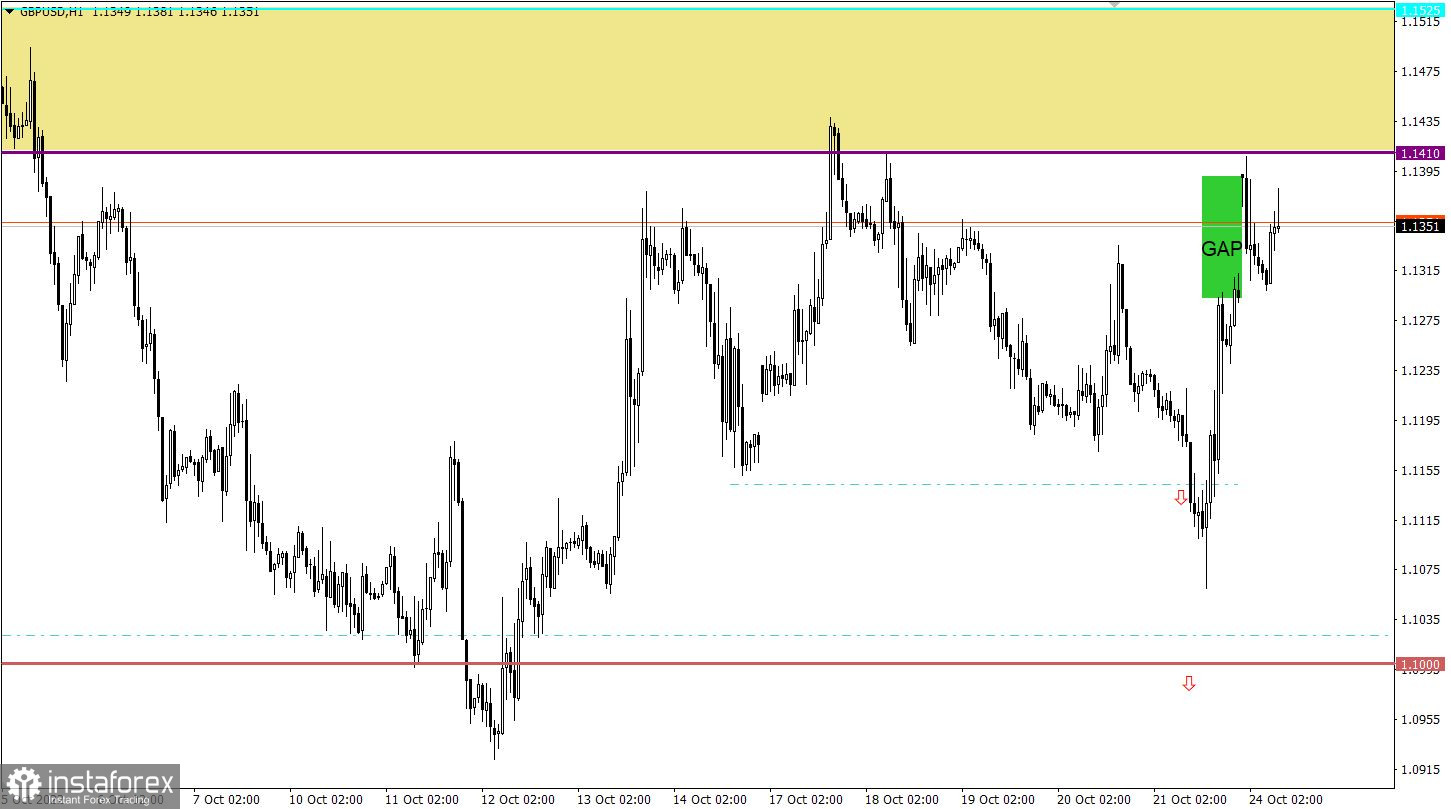
The GBPUSD currency pair showed strong activity at the end of last week. As a result, the pound sterling first collapsed by more than 150 points, approaching the psychological level of 1.1000, and then strengthened by 250 points. This kind of V-shaped amplitude indicates a multidirectional trading interest among market participants.

Economic calendar for October 24
Preliminary data on business activity indices in Europe and the United Kingdom have already been published today, where the indicators came out worse than expected.
Details:
The Eurozone manufacturing PMI for October fell from 48.4 to 46.6 points, with a forecast of 47.8 points. Services PMI fell from 48.8 to 48.2 points, while composite PMI fell from 48.1 to 47.1 points.
The euro reacts to the statistics with a decline.
The UK manufacturing PMI for October fell from 48.4 to 45.8 points, with a forecast of 48.0 points. Services PMI fell from 50.0 to 47.5 points, with a forecast of 47.5 points, while composite PMI fell from 50.0 to 47.5 points.
The pound reacts to the statistics with a decrease.
During the American trading session, the US manufacturing PMI is also expected, which is predicted to decrease from 51.1 to 52.0 points.
Time targeting:
US Manufacturing PMI – 13:45 UTC
In terms of information flow, traders should pay special attention to the political race for the seat of the British Prime Minister. This news may provoke new speculative price hikes.
Trading plan for EUR/USD on October 24
In this situation, the level of 0.9850 once again led to a reduction in the volume of long positions in the euro. This step, in turn, led to a slowdown in the upward cycle, as a result of the price pullback. It can be assumed that the strongest technical signal to buy the euro may occur only after the quote holds above 0.9900 in a four-hour period. Otherwise, the pullback/stagnation scenario will be relevant in the market.
Trading plan for GBP/USD on October 24
The new trading week was opened with an upward price gap of about 100 points, which led to touching the lower border of the 1.1410/1.1525 resistance area. On the basis of such a sharp strengthening of the pound, there was a technical signal of overbought in short-term time periods. This has already led to a pullback, but the strengthening of short positions on the pound may occur after holding the price below the gap - 1.1290.
As for the upward scenario, the quote needs to return to the resistance area. As to how speculators will behave within the values of 1.1410/ 1.1525, the subsequent course of the price will be clear.
What is shown in the trading charts?
A candlestick chart view is graphical rectangles of white and black light, with sticks on top and bottom. When analyzing each candle in detail, you will see its characteristics of a relative period: the opening price, closing price, and maximum and minimum prices.
Horizontal levels are price coordinates, relative to which a stop or a price reversal may occur. These levels are called support and resistance in the market.
Circles and rectangles are highlighted examples where the price of the story unfolded. This color selection indicates horizontal lines that may put pressure on the quote in the future.
The up/down arrows are the reference points of the possible price direction in the future.


