


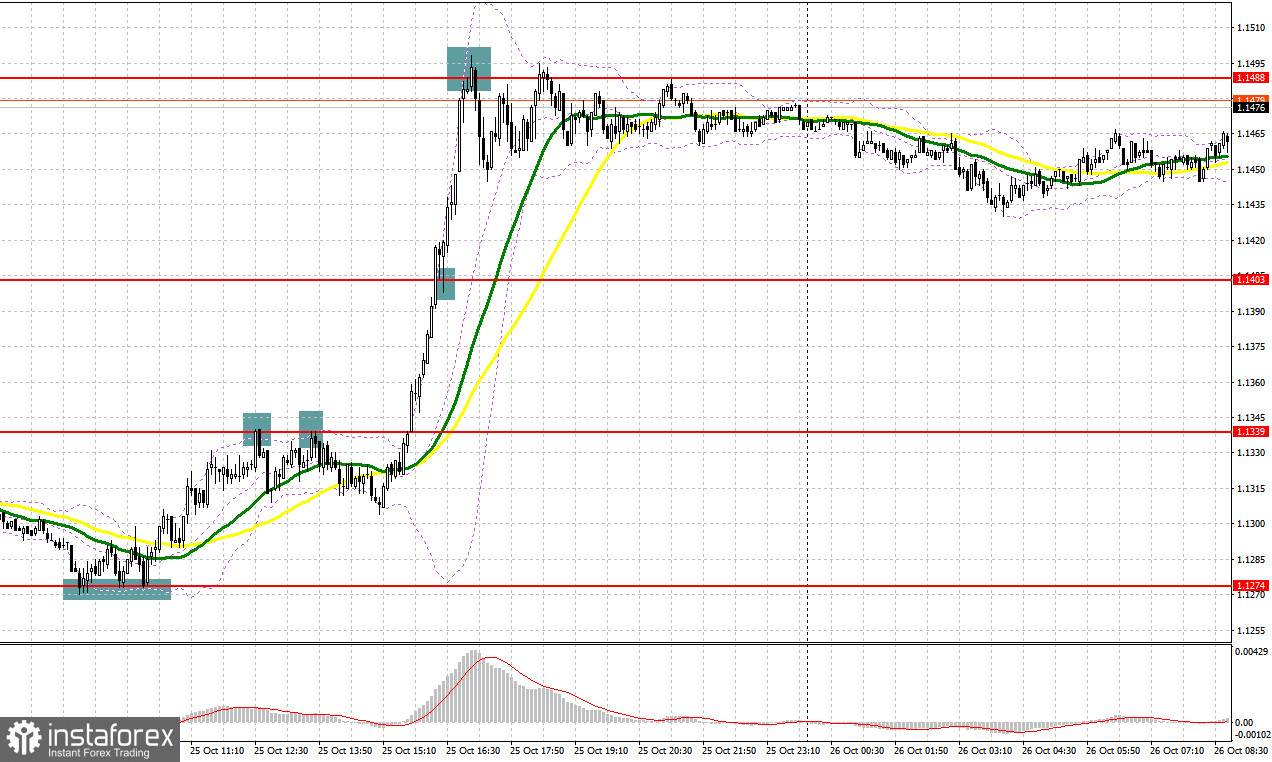
Yesterday, a huge number of excellent market entry signals were formed. Let's take a look at the 5-minute chart and figure out what happened. I paid attention to the 1.1274 level in my morning forecast and advised making decisions on entering the market there. The decline and false breakout in the area of 1.1274 were not long in coming, which led to a buy signal and the pound's spurt up by more than 60 points. With an update of 1.1339, the bears defended this level and gave a sell signal. But the downward movement was only about 25 points. In the afternoon, the bears once again defended 1.1339, but the fall again amounted to just over 30 points. After weak statistics on the US, the pound rushed up, and a breakthrough and reverse test of 1.1403 from the top down gave a good buy signal, after which the pair went up about 80 points. Closer to the middle of the US session, protecting a false breakout in the area of 1.1488 made it possible to get a sell signal with a correction of the pound down by 40 points.
When to go long on GBP/USD:
Today there are no statistics on the UK at all, but they are not required for the pound's succeeding growth. A general increase in risk appetite and a sharp slowdown in economic performance in the US indicate that the dollar will continue to lose ground due to the serious risk of a recession. But we should not forget about the problems in the UK and it is far from clear how the new prime minister will act in this situation. In case GBP/USD falls, forming a false breakout at the level of 1.1430, which was formed at the end of the Asian session, will give a buy signal in order to update the nearest resistance at 1.1488, which is a weekly high. A breakthrough and test from the top to the bottom of this range could change the situation dramatically, allowing bulls to build a more powerful upward trend with the prospect of updating October highs. This forms a new buy signal with growth towards the next resistance at 1.1539 and the prospect of an update at 1.1584. The farthest target of the bulls will be 1.1631, where I recommend taking profits.
If the bulls do not cope with the tasks set and miss 1.1430, which is unlikely in such a market, the pressure on the pair will quickly return - this will lead to new active shorts on the pound. In this case, I advise you to buy only on a false breakout in the area of 1.1392, where the moving averages pass, playing on the bulls' side. I recommend opening long positions on GBP/USD immediately for a rebound from 1.1348, or even lower - around 1.1307 with the goal of correcting 30-35 points within the day.
When to go short on GBP/USD:
Bears have lost all chances of returning to the market, but given the negative statistics coming out in the US, and what is expected today, this is not surprising. Don't rush into selling yet: the best scenario for opening shorts would be a false breakout near the resistance area of 1.1488, but at the same time, a divergence should form on the MACD indicator. This will make it possible for you to get a good entry point with the goal of moving to the support of 1.1430, otherwise the pound will continue to rise with renewed vigor. A breakthrough and test back up at 1.1430 would be a good setup with an exit to the 1.1392 low, where the moving averages, already playing on the bulls' side, pass. The farthest target will be the area of 1.1348, where I recommend taking profits.
In case GBP/USD grows and the bears are not active at 1.1488, the bulls will continue to return to the market, counting on building a new upward trend. This will push the GBP/USD to the 1.1539 area. Only a false breakout at this level will provide an entry point into shorts with the goal of a new decline. If traders are not active there, I advise you to sell GBP/USD immediately for a rebound from 1.1584, counting on the pair's rebound down by 30-35 points within the day.
COT report:
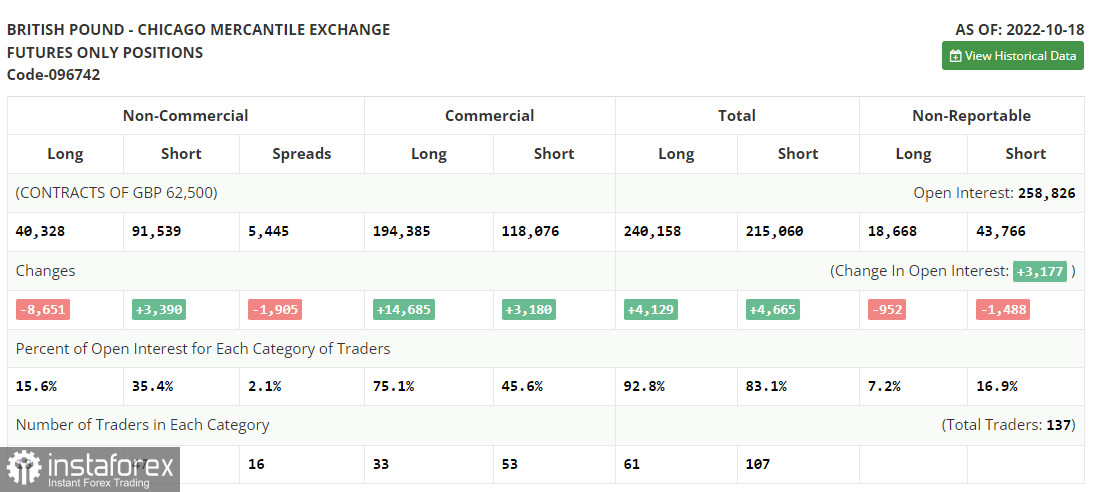
The Commitment of Traders (COT) report for October 18 logged a sharp reduction in long positions and an increase in shorts. The resignation of British Prime Minister Liz Truss and the appointment of Rishi Sunak to her post had a positive effect on the British pound, but rising inflation in the UK did not allow investors to fully believe that the economy would be able to endure all that awaits it in the near future: an increase in the cost of living crisis, an increase in the energy crisis and high interest rates. Also, there was a sharp decline in retail sales most recently in the UK - the main engine of economic growth, which once again confirms the fact that households have serious problems due to high prices, discouraging any desire to spend extra money. Until the UK authorities deal with the problems and find a way out of the current situation, the pressure on the pound will continue. The latest COT report indicated that long non-commercial positions decreased by 8,651 to 40,328, while short non-commercial positions rose by 3,390 to 91,539, resulting in a slight increase in the negative non-commercial net position to -51,211 versus -39,170. The weekly closing price increased and amounted to 1.1332 versus 1.1036.
Indicator signals:
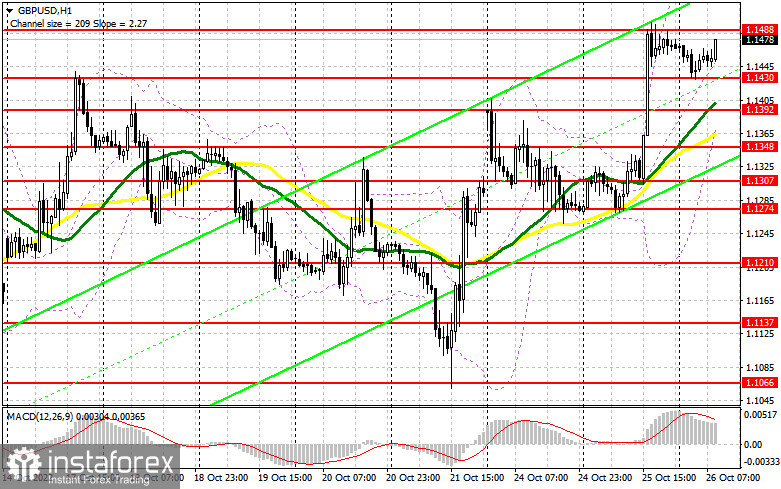
Trading is above the 30 and 50-day moving averages, which indicates an attempt by the bulls to take over the market.
Moving averages
Note: The period and prices of moving averages are considered by the author on the H1 hourly chart and differs from the general definition of the classic daily moving averages on the daily D1 chart.
Bollinger Bands
In case of a decline, the lower border of the indicator in the area of 1.1392 will act as support.
Description of indicators
- Moving average (moving average, determines the current trend by smoothing out volatility and noise). Period 50. It is marked in yellow on the chart.
- Moving average (moving average, determines the current trend by smoothing out volatility and noise). Period 30. It is marked in green on the chart.
- MACD indicator (Moving Average Convergence/Divergence — convergence/divergence of moving averages) Quick EMA period 12. Slow EMA period to 26. SMA period 9
- Bollinger Bands (Bollinger Bands). Period 20
- Non-commercial speculative traders, such as individual traders, hedge funds, and large institutions that use the futures market for speculative purposes and meet certain requirements.
- Long non-commercial positions represent the total long open position of non-commercial traders.
- Short non-commercial positions represent the total short open position of non-commercial traders.
- Total non-commercial net position is the difference between short and long positions of non-commercial traders.


