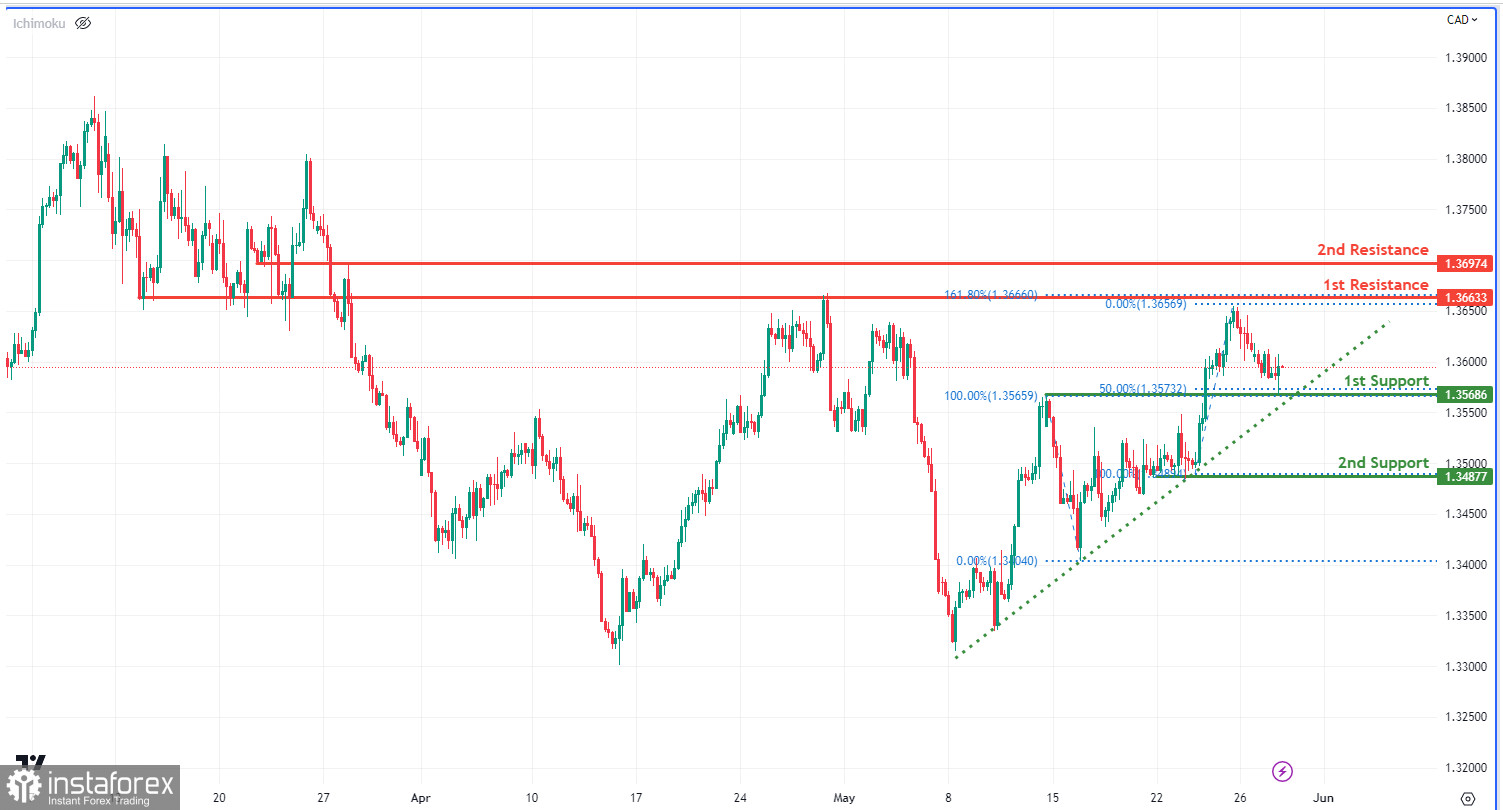
The USD/CAD chart is currently displaying bullish momentum, indicating a potential continuation of the upward trend. The first support level at 1.3569, an overlap support and 50% Fibonacci retracement point, has historical significance where buyers have previously entered the market. The second support level at 1.3488, also an overlap support, has shown resilience in the past. On the resistance side, the first resistance level at 1.3663, an overlap resistance and 161.80% Fibonacci extension point, could temporarily halt further upward movement. The second resistance level at 1.3697, another overlap resistance, has previously seen selling pressure, reinforcing its role as a potential ceiling for the price.


