


Analysis of Wednesday's deals:
30M chart of the GBP/USD pair
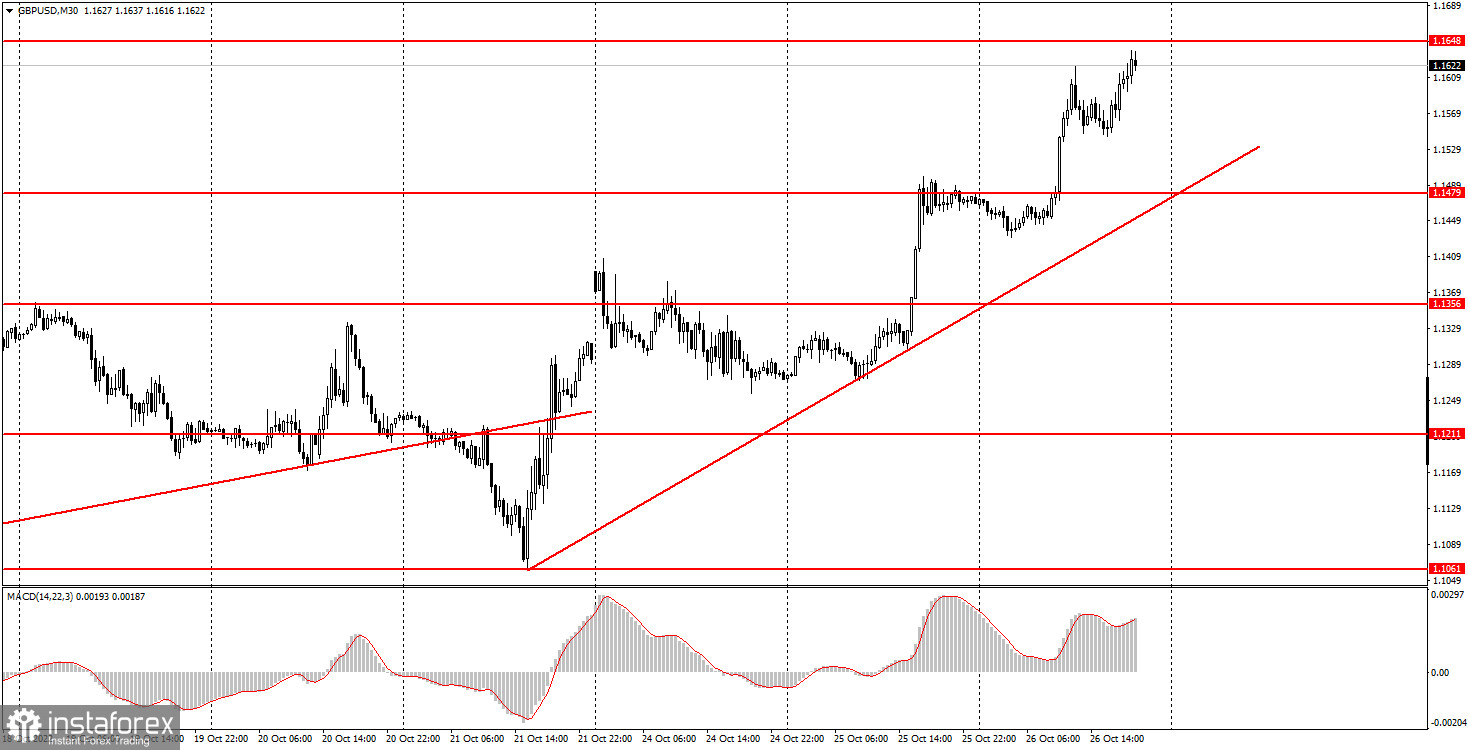
The GBP/USD pair also continued to grow quite strongly on Wednesday, which was also not justified by the fundamental or macroeconomic background. In fact, both pairs showed an identical upward movement for two days in a row, which was nothing and could not be provoked. A lot of different guesses and hypotheses immediately arise from the fact that one of the currencies is pulling the second along, ending with the fact that this is a "trap for the bulls" and then a new powerful collapse will follow. However, for now, the British currency is growing, and we have formed a new ascending trend line, by overcoming which it will be possible to understand that the upward momentum has ended. As already mentioned, there was not a single important report or just an event that could provoke the pound's growth by 130 points on Wednesday. If this was an isolated incident, we would say that it was an accident. However, this picture has been observed for two consecutive days... The European Central Bank meeting will be held on Thursday, which has nothing to do with the pound, but we won't be surprised if both pairs move identically on this day.
5M chart of the GBP/USD pair
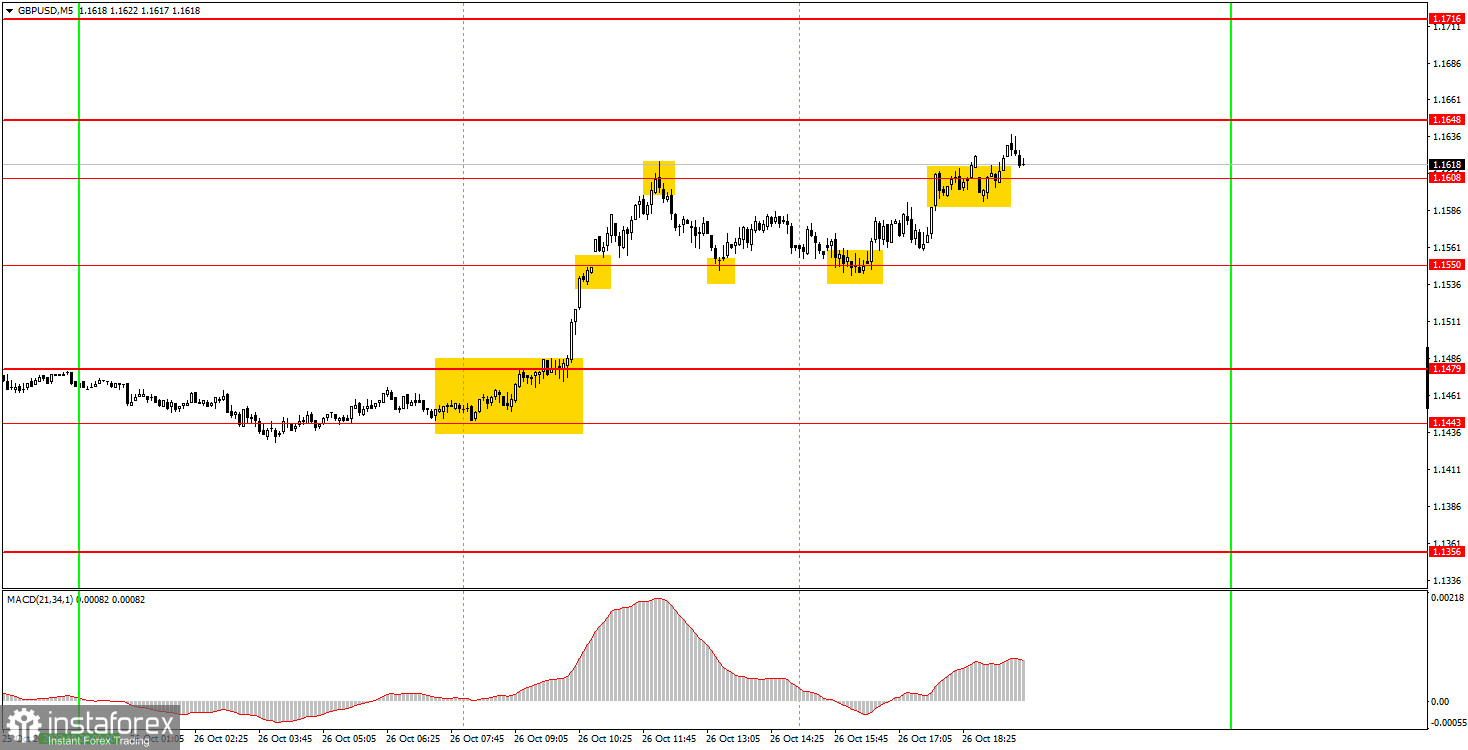
There were a lot of trading signals on the 5-minute timeframe on Wednesday and almost all of them turned out to be correct. It all started with the price surpassing the area of 1.1443-1.1479, after which the pair rose first to 1.1550, and then to 1.1608. A rebound from the latter should have been interpreted as a signal to sell and a reason to close long positions. Profit amounted to 75 points. Shorts should have been opened at the same moment, but the rebound from the level of 1.1550 led to their closure. Profit is about 30 points more. The buy signal turned out to be false, but even in this case, the pair managed to move up 20 pips before returning to 1.1550. The position was closed by Stop Loss at breakeven. New bounce from 1.1550, a new buy signal and growth to 1.1608 with a breakthrough. The last long position should have been closed near the 1.1608 level or manually, but it also turned out to be profitable. Therefore, novice players could earn at least 130-140 points of profit, which is just an excellent result. Not a single losing trade during the day!
How to trade on Thursday:
The pound/dollar pair resumed its upward movement on the 30-minute TF, but it's too early to rejoice, because we may well see a fall on Thursday. A new trend line has been formed and so far there is no reason to assume the pair will fall. But the European Central Bank meeting, although not directly related to the pound, can still affect it. On the 5-minute TF on Thursday it is recommended to trade at the levels 1.1356, 1.1443, 1.1479, 1.1550, 1.1608, 1.1648, 1.1716, 1.1755, 1.1793, 1.1863- 1.1877. When the price passes after opening a position in the right direction for 20 points, Stop Loss should be set to breakeven. There are no important events scheduled for Thursday in the UK, but there will be important events in the European Union and important reports in the US. Thus, Thursday could turn out to be an ultra-volatile day.
Basic rules of the trading system:
1) The signal strength is calculated by the time it took to form the signal (bounce or overcome the level). The less time it took, the stronger the signal.
2) If two or more positions were opened near a certain level based on false signals (which did not trigger Take Profit or the nearest target level), then all subsequent signals from this level should be ignored.
3) In a flat, any pair can form a lot of false signals or not form them at all. But in any case, at the first signs of a flat, it is better to stop trading.
4) Trade positions are opened in the time period between the beginning of the European session and until the middle of the US one, when all positions must be closed manually.
5) On the 30-minute TF, using signals from the MACD indicator, you can trade only if there is good volatility and a trend, which is confirmed by a trend line or a trend channel.
6) If two levels are located too close to each other (from 5 to 15 points), then they should be considered as an area of support or resistance.
On the chart:
Support and Resistance Levels are the Levels that serve as targets when buying or selling the pair. You can place Take Profit near these levels.
Red lines are the channels or trend lines that display the current trend and show in which direction it is better to trade now.
The MACD indicator (14,22,3) consists of a histogram and a signal line. When they cross, this is a signal to enter the market. It is recommended to use this indicator in combination with trend lines (channels and trend lines).
Important speeches and reports (always contained in the news calendar) can greatly influence the movement of a currency pair. Therefore, during their exit, it is recommended to trade as carefully as possible or exit the market in order to avoid a sharp price reversal against the previous movement.
Beginners on Forex should remember that not every single trade has to be profitable. The development of a clear strategy and money management are the key to success in trading over a long period of time.


