


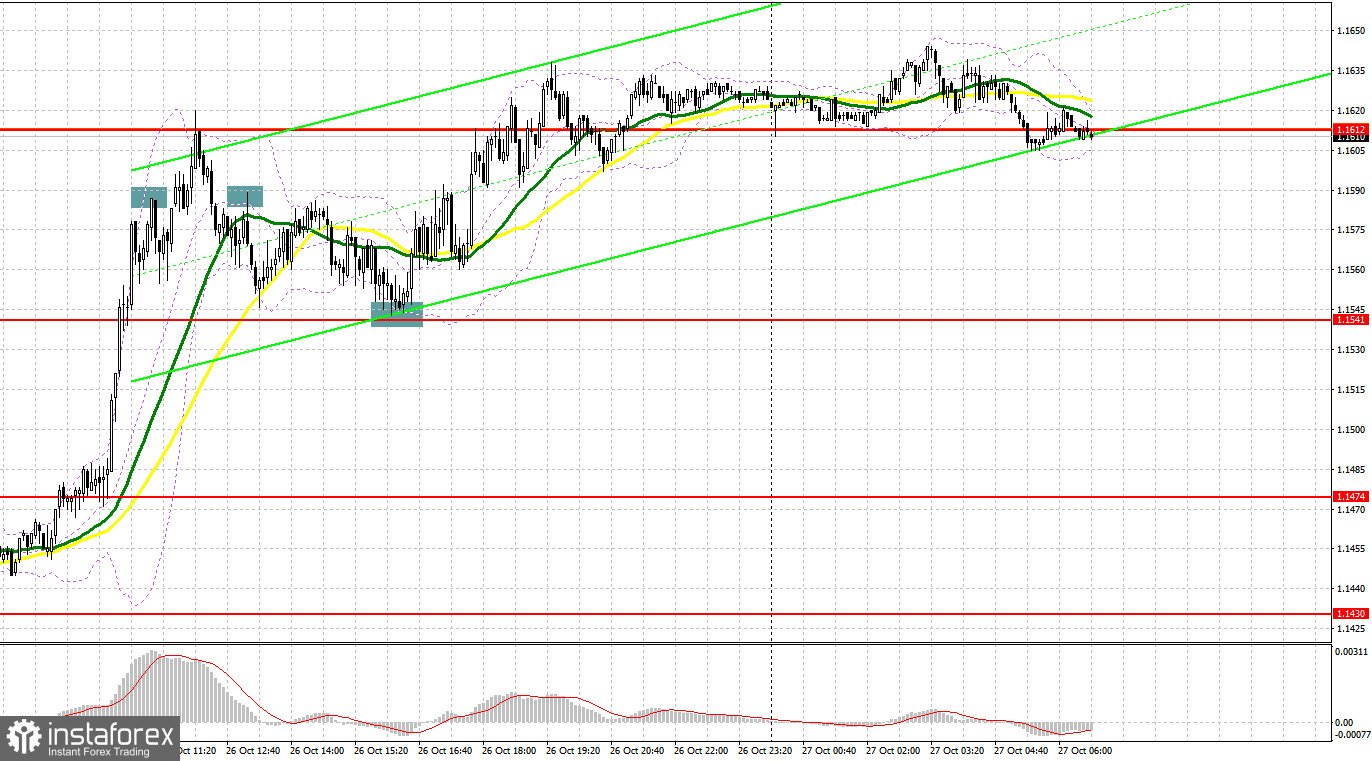
Yesterday, several market entry signals were formed. Let's take a look at the 5-minute chart and figure out what happened. I paid attention to the 1.1584 level in my morning forecast and advised making decisions on entering the market there. The pound continued to sharply rise in the first half of the day, which I hinted at in the morning forecast. As a result of the upward movement, the bulls managed to get to the resistance of 1.1584, where they stopped. A false breakout at this level gave a good sell signal, which resulted in a more than 40 points downward move. After a rather significant correction in the afternoon, a false breakout in the 1.1541 support area led to a wonderful signal to buy the pound and, together with weak data on the US housing market, the pair flew up by more than 70 points.
When to go long on GBP/USD:
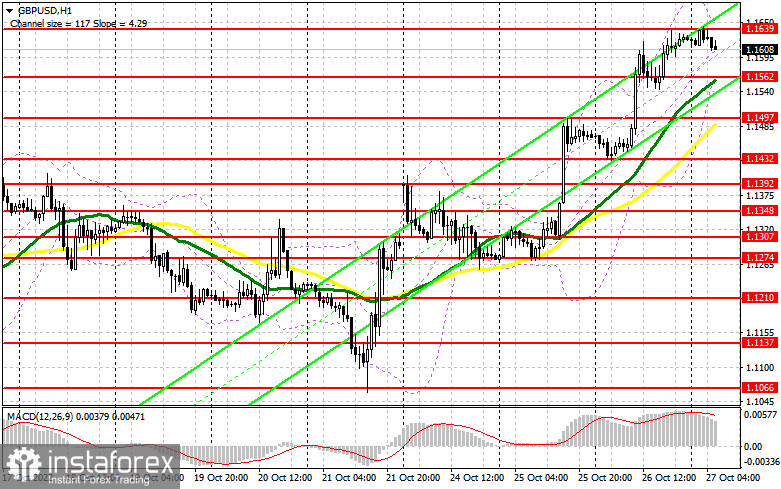
The UK will only release a report on retail sales according to the Confederation of Industrialists. This suggests that the pound has every chance of a larger downward correction in the first half of the day, even before the announcement of the European Central Bank's decision, which will partially affect the GBP/USD pair: the demand for risky assets depends on the overall picture and general actions of the world central banks, and if ECB officials act as aggressively as their counterparts from the Bank of England and the Federal Reserve, demand for the pound could also strengthen. In case we receive very weak retail sales figures, the pair may correct to the nearest support area of 1.1562. Forming a false breakout there will provide a buy signal in order to restore and update the resistance of 1.1639, formed at the end of the Asian session. A breakthrough and a downward test of this range may change the situation dramatically, allowing bulls to build a more powerful upward trend with the prospect of updating 1.1684 and further exit to 1.1726. The farthest target of the bulls will be 1.1757, where I recommend taking profits.
If the bulls fail to meet their targets and miss 1.1562, the pressure on the pair will quickly return as many players start taking profits after such a bullish rally seen since October 21st. In this case, I advise you to buy only on a false breakout in the area of 1.1497, where the moving averages pass, playing on the bulls' side. I recommend opening long positions on GBP/USD immediately for a rebound from 1.1432, or even lower - around 1.1392, counting on correcting 30-35 points within the day.
When to go short on GBP/USD:
Bears continue to carry the burden, but today they will have a chance to recover. It is necessary to protect the nearest resistance at 1.1639. The optimal scenario for opening short positions there would be a false breakout after an unsuccessful attempt to grow amid retail sales data. This will make it possible to get a good entry point with the goal of moving to the support of 1.1562. A breakthrough and reverse test from below 1.1562 will be a good setup to reach the low of 1.1497, where the moving averages pass, and the lower border of the rising price channel from October 21 is also located. The farthest target will be the area of 1.1432, where I recommend taking profits.
In case GBP/USD grows and there are no bears at 1.1639, and you do not forget about the emerging divergence on the MACD indicator, which may limit further growth potential, the bulls will continue to enter the market, counting on the continuation of the upward trend. This will push the GBP/USD to the 1.1684 area. Only a false breakout at this level will provide an entry point into short positions with the goal of moving down. If traders are not active there, I advise you to sell GBP/USD immediately for a rebound from 1.1726, counting on the pair's rebound down by 30-35 points within the day.
COT report:
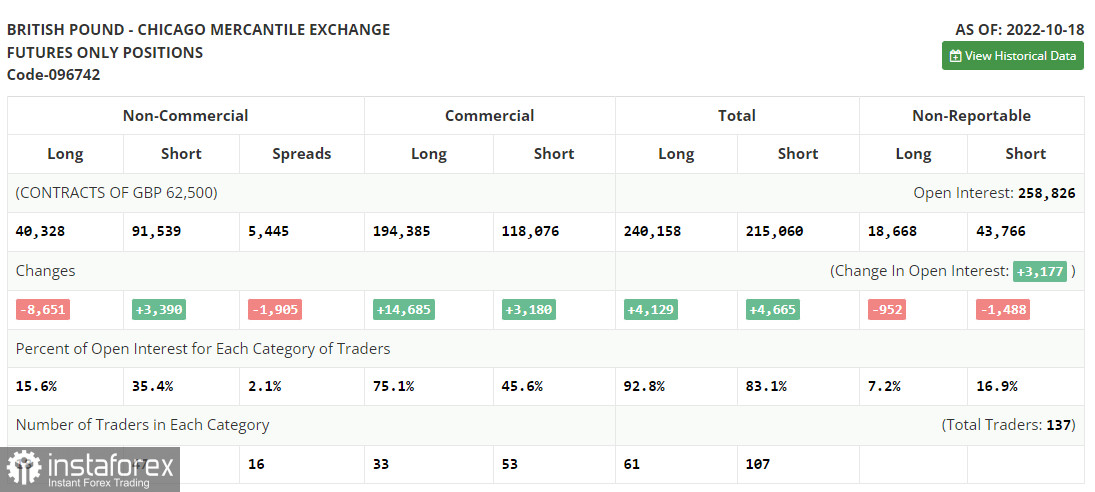
The Commitment of Traders (COT) report for October 18 logged a sharp reduction in long positions and an increase in shorts. The resignation of British Prime Minister Liz Truss and the appointment of Rishi Sunak to her post had a positive effect on the British pound, but rising inflation in the UK did not allow investors to fully believe that the economy would be able to endure all that awaits it in the near future: an increase in the cost of living crisis, an increase in the energy crisis and high interest rates. Also, there was a sharp decline in retail sales most recently in the UK - the main engine of economic growth, which once again confirms the fact that households have serious problems due to high prices, discouraging any desire to spend extra money. Until the UK authorities deal with the problems and find a way out of the current situation, the pressure on the pound will continue. The latest COT report indicated that long non-commercial positions decreased by 8,651 to 40,328, while short non-commercial positions rose by 3,390 to 91,539, resulting in a slight increase in the negative non-commercial net position to -51,211 versus -39,170. The weekly closing price increased and amounted to 1.1332 versus 1.1036.
Indicator signals:
Trading is above the 30 and 50 day moving averages, indicating a bull market.
Moving averages
Note: The period and prices of moving averages are considered by the author on the H1 hourly chart and differs from the general definition of the classic daily moving averages on the daily D1 chart.
Bollinger Bands
In case of a decline, the lower border of the indicator around 1.1562 will act as support.
Description of indicators
- Moving average (moving average, determines the current trend by smoothing out volatility and noise). Period 50. It is marked in yellow on the chart.
- Moving average (moving average, determines the current trend by smoothing out volatility and noise). Period 30. It is marked in green on the chart.
- MACD indicator (Moving Average Convergence/Divergence — convergence/divergence of moving averages) Quick EMA period 12. Slow EMA period to 26. SMA period 9
- Bollinger Bands (Bollinger Bands). Period 20
- Non-commercial speculative traders, such as individual traders, hedge funds, and large institutions that use the futures market for speculative purposes and meet certain requirements.
- Long non-commercial positions represent the total long open position of non-commercial traders.
- Short non-commercial positions represent the total short open position of non-commercial traders.
- Total non-commercial net position is the difference between short and long positions of non-commercial traders.


