


Analyzing trades on Thursday:
EUR/USD on 30M chart
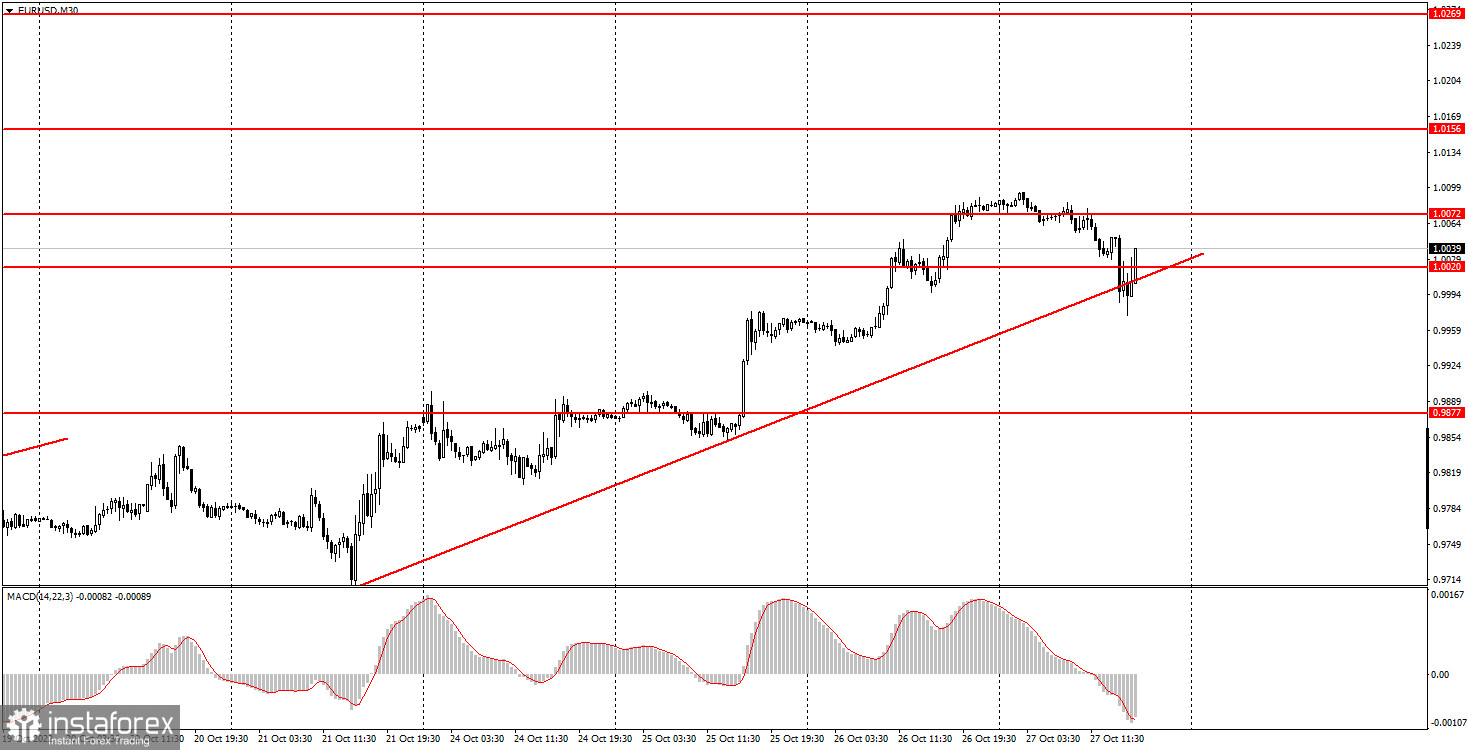
EUR/USD was rather volatile on Thursday although the fluctuation range was less than we expected. The key event of the day was the ECB meeting and its results. Surprisingly, the euro fell after this event even though the regulator raised rates by 0.75%. However, we warned you yesterday that market reaction can be unpredictable as it usually happens after central banks' meetings. Later in the day, the pair started to rise. So, as you can see, there was no logic behind the market movement. In the course of the day, the price dropped to the trendline on the 30-minute time frame but failed to break through it. This means that the uptrend is still relevant. Markets will now focus on the upcoming Fed meeting that is due next Wednesday. Ahead of this event, the US dollar may ease in the coming days as the US regulator is planning to raise the rate by 0.75% as well. Therefore, if the price settles below the ascending trendline, this should be considered a sell signal.
EUR/USD on M5 chart
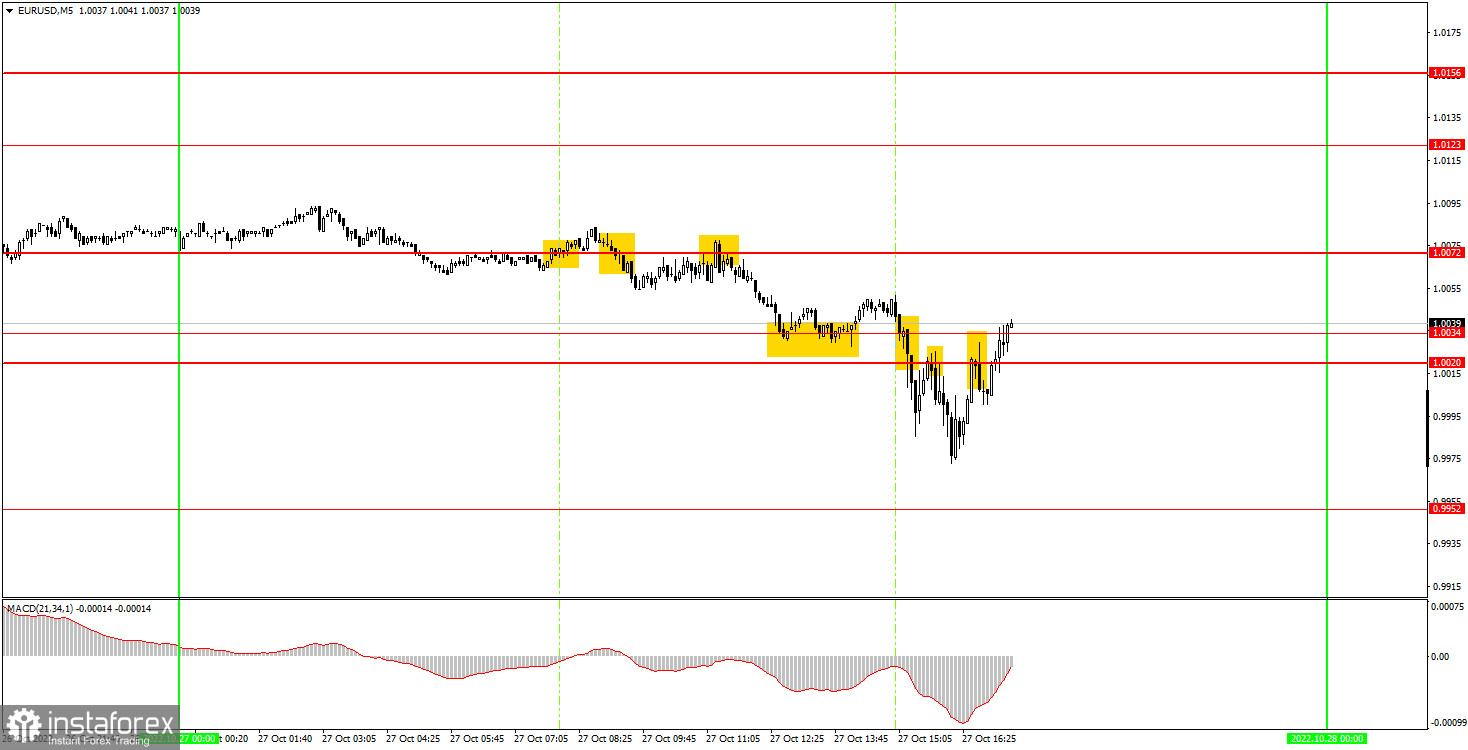
There were plenty of trading signals on the 5-minute chart on Thursday. Yet, traders had to be very careful when following them due to the important news background. Four signals were formed in the European trading session but the price movement was weak. The first signal when the price settled above 1.0072 turned out to be false. It generated a loss of 20 pips. Then a sell signal was formed near the same level, and the price fell to 1.0034 which allowed beginners to win back those 20 pips. The buy signal near 1.0034 was also false but there was no need to follow it as the ECB meeting was coming. Besides, there was no way to secure the trade by setting a Stop Loss to breakeven. This is why all other signals emerging in the American session should also have been ignored. Apart from the ECB meeting, the US published important macroeconomic data. Besides, Christine Lagarde made a statement after the meeting. So, trading EUR/USD on Thursday ended with a zero profit.
Trading tips on Friday
In the 30-minute time frame, the pair formed a new uptrend and is staying within this trend. At the same time, the price made an attempt to settle below the trendline. What is more, the US dollar may resume growth ahead of the Fed meeting. On the 5M chart on Friday, it is recommended to trade at the levels of 0.9807, 0.9877, 0.9952, 1.0020-1.0034, 1.0072, 1.0123, 1.0156, and 1.0221. As soon as the price moves by 15 pips in the right direction, you should set a Stop Loss to breakeven. No important reports or events are expected in the EU on Friday. The US will publish some minor reports such as personal income and spending and Michigan consumer sentiment. So, the market is likely to downplay these reports.
Basic rules of the trading system
1) The strength of the signal is determined by the time it took the signal to form (a rebound or a breakout of the level). The quicker it is formed, the stronger the signal is.
2) If two or more positions were opened near a certain level based on a false signal (which did not trigger a Take Profit or test the nearest target level), then all subsequent signals at this level should be ignored.
3) When trading flat, a pair can form multiple false signals or not form them at all. In any case, it is better to stop trading at the first sign of a flat movement.
4) Trades should be opened in the period between the start of the European session and the middle of the US trading hours when all positions must be closed manually.
5) You can trade using signals from the MACD indicator on the 30-minute time frame only amid strong volatility and a clear trend that should be confirmed by a trendline or a trend channel.
6) If two levels are located too close to each other (from 5 to 15 pips), they should be considered support and resistance levels.
On the chart
Support and Resistance levels are the levels that serve as targets when buying or selling the pair. You can place Take Profit near these levels.
Red lines are channels or trend lines that display the current trend and show in which direction it is better to trade now.
The MACD indicator (14, 22, and 3) consists of a histogram and a signal line. When they cross, this is a signal to enter the market. It is recommended to use this indicator in combination with trend patterns (channels and trendlines).
Important announcements and economic reports that can be found on the economic calendar can seriously influence the trajectory of a currency pair. Therefore, at the time of their release, we recommend trading as carefully as possible or exiting the market in order to avoid sharp price fluctuations.
Beginners on Forex should remember that not every single trade has to be profitable. The development of a clear strategy and money management is the key to success in trading over a long period of time.


