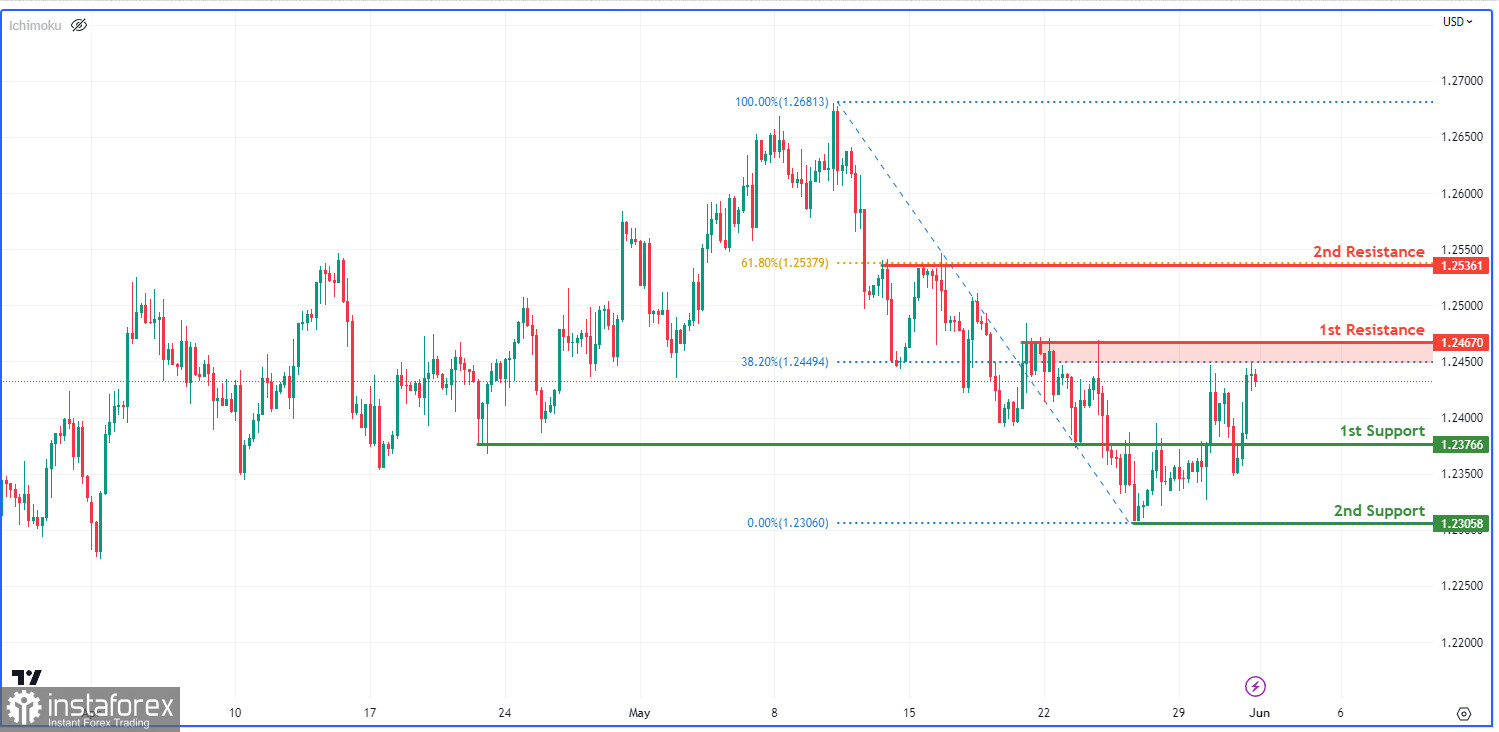
The GBP/USD chart currently shows a bearish momentum, suggesting a downward trend. There is a possibility of a bearish reaction from the first resistance level, leading to a decline towards the first support level. The 1.2376 level is a significant support area, previously attracting buyers. The second support at 1.2305 adds further strength as a swing low support. On the other hand, the first resistance at 1.2467 may cause a temporary pause or retracement, being a multi-swing high resistance and coinciding with the 38.20% Fibonacci retracement level. The second resistance at 1.2536 is also notable, aligning with the 61.80% Fibonacci retracement level. Traders should monitor these levels for potential trading opportunities or changes in market sentiment.


