


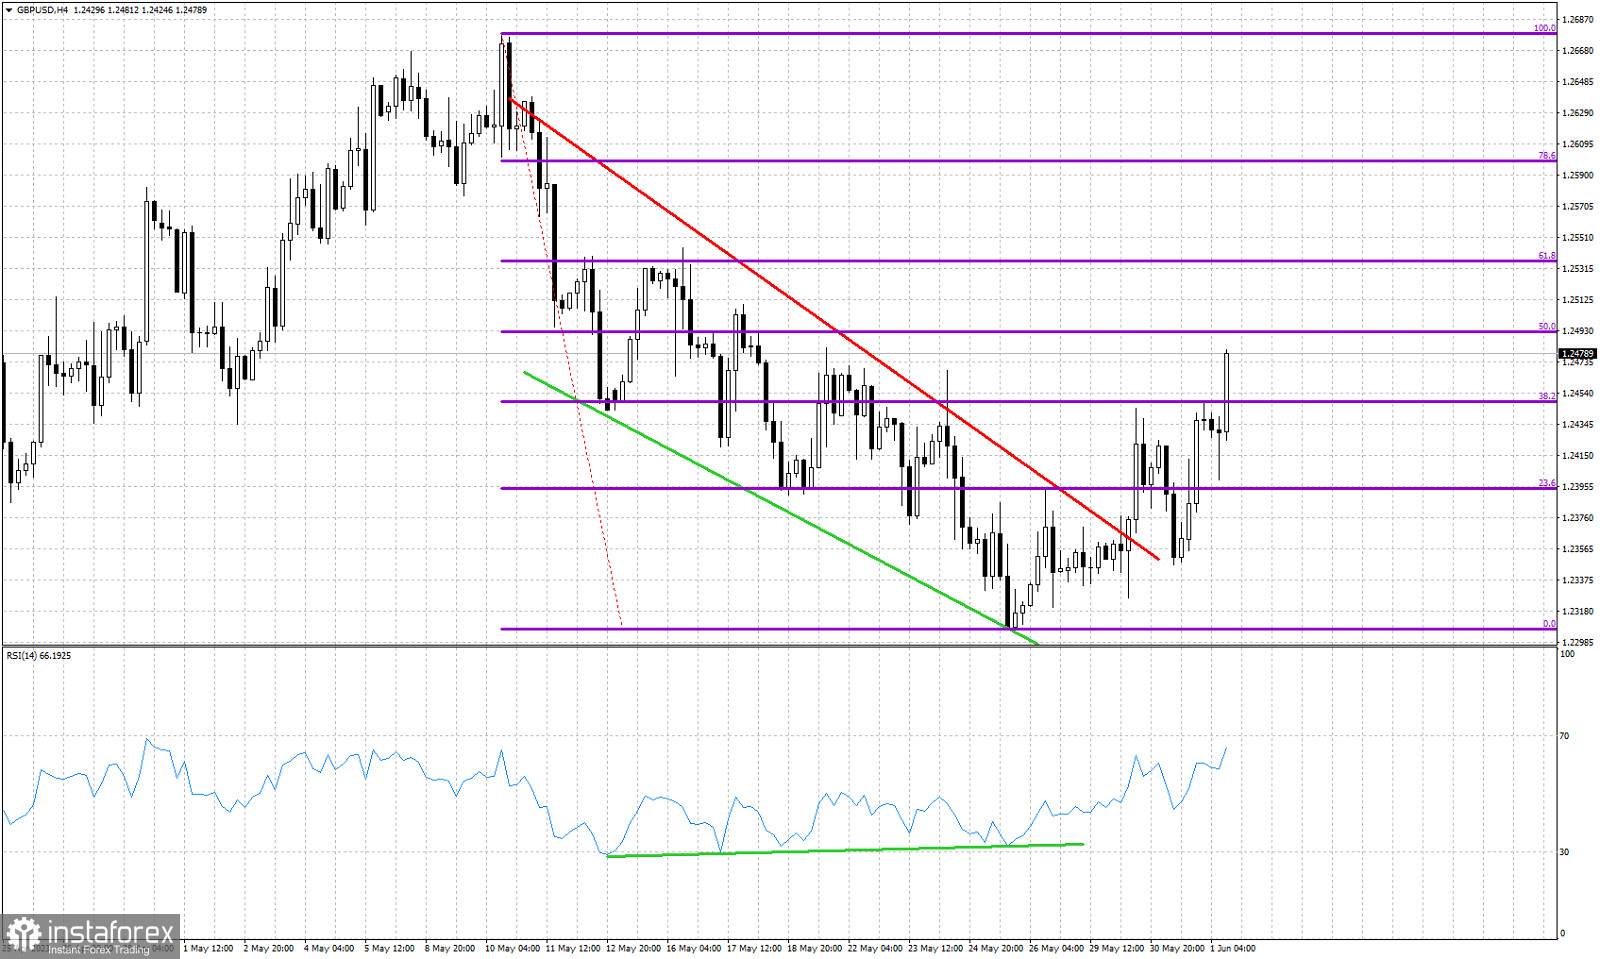
Violet lines -Fibonacci retracement levels
green lines- bullish RSI divergence
Red line -resistance trend line
As we mentioned in our last analysis on GBPUSD, price was providing a bullish reversal signal but with price challenging an important Fibonacci resistance at 1.2450, a pull back to form a higher low was justified. Price did exactly that as it pulled back towards 1.2346. In our previous analysis we noted that as long as we trade above 1.2326 we remain bullish. Support was held. Price formed a higher low and is now pushing to new higher highs exactly as our expectations posted on May 30th.


