


Analysis of Monday's deals:
30M chart of the GBP/USD pair
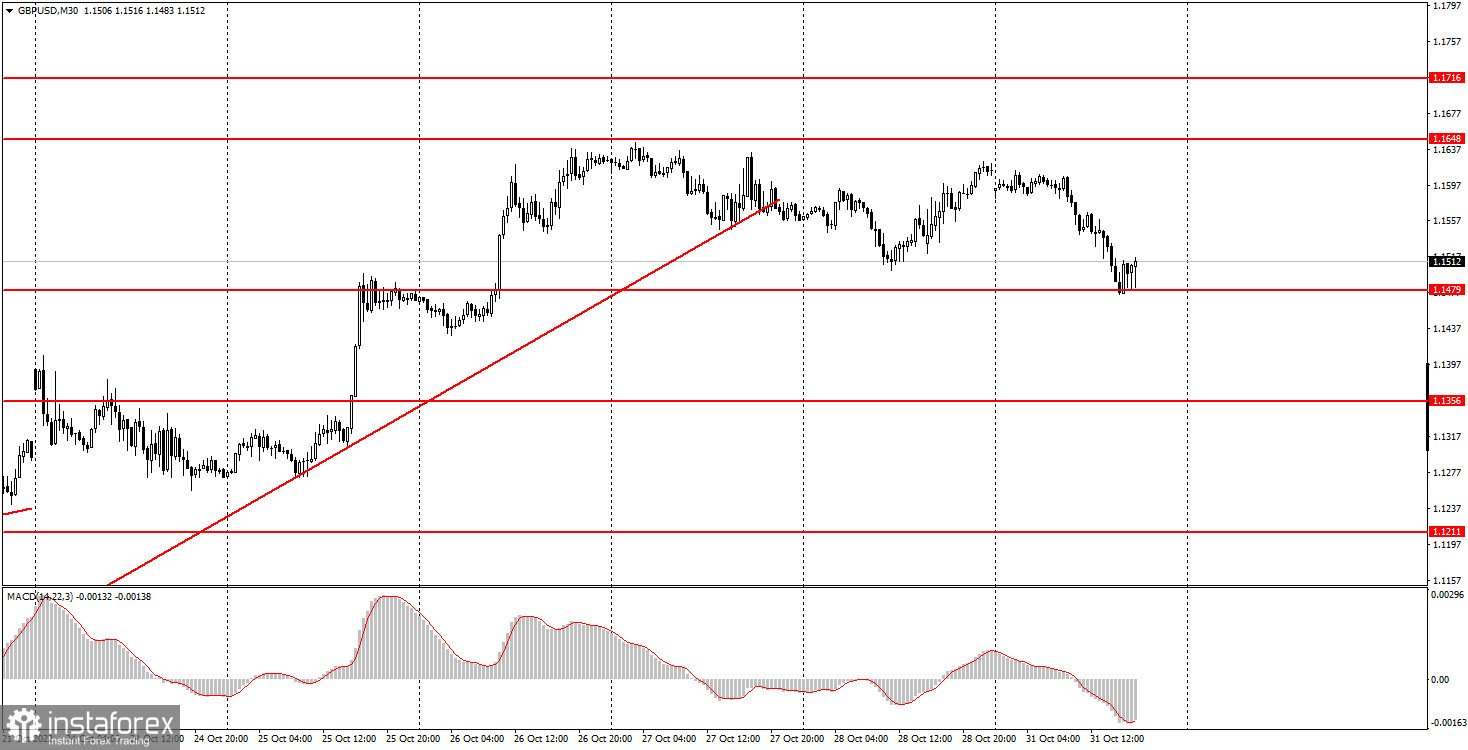
The GBP/USD pair also resumed corrective movement on Monday after overcoming the ascending trend line. Thus, the pound was also moving quite logically and reasonably. There was not a single important event or report in the UK and the US, so we are even more convinced that Monday's movement is working out the future Federal Reserve meeting "in advance". Of course, the pound is also interested in the Bank of England meeting, which will be held on Thursday, at which rates will also be raised. But let us recall that the previous seven BoE rate hikes did not have any beneficial effect on the pound. Therefore, it is possible that traders will react to the results of this meeting afterwards, on Thursday. Well, the US currency may continue to strengthen until Wednesday. What we saw last Thursday with the example of the ECB meeting could also happen this Wednesday. The euro grew before the meeting, winning back the rate hike, and then began to fall. Therefore, this week, the dollar may rise before the Fed meeting, and then fall.
5M chart of the GBP/USD pair
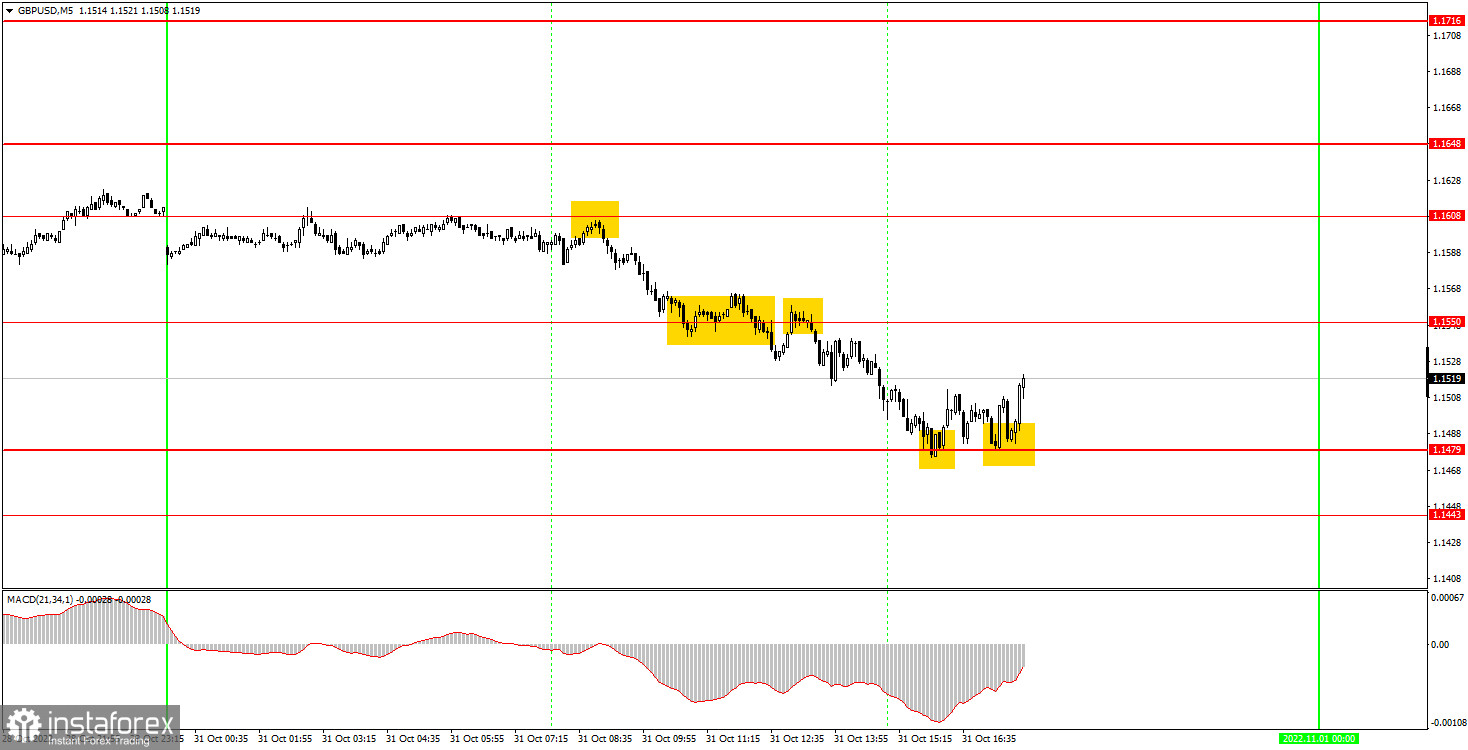
On the 5-minute timeframe for the pound, a fairly large number of trading signals were formed on Monday. Moreover, we managed to catch the downward movement from the very beginning, which is very good. The pair rebounded from the level of 1.1608 with a small error at the very beginning of the European trading session, after which it dropped and overcame the level of 1.1550, and then reached the level of 1.1479, from which it rebounded twice. Short positions should have been closed around the level of 1.1479. Profit was about 100 points, as the pound volatility was high again. A buy signal near the level of 1.1479 could also be worked out. The first one turned out to be false, and the price couldn't go up 20 pips to set Stop Loss to breakeven. But it did not go below the level of 1.1479 either, so the long position should have remained open even at the time of the formation of the second buy signal. This time, 20 pips up were passed, so novice traders definitely did not receive a loss on this position. If you closed it manually, you could get another ten points of profit.
How to trade on Tuesday:
The pound/dollar pair overcame the ascending trend line on the 30-minute timeframe and found the strength to continue moving down. Thus, so far the movement does not raise any questions, but this week we can witness several reversals and strong movements. On the 5-minute TF on Tuesday it is recommended to trade at the levels 1.1236, 1.1356, 1.1443, 1.1479, 1.1550, 1.1608, 1.1648, 1.1716. When the price passes after opening a position in the right direction for 20 points, Stop Loss should be set to breakeven. Only the index of business activity in the manufacturing sector will be released in the UK. A similar index in two variations will be released in the US. We assume that some market reaction will follow, especially if it is in favor of the US dollar.
Basic rules of the trading system:
1) The signal strength is calculated by the time it took to form the signal (bounce or overcome the level). The less time it took, the stronger the signal.
2) If two or more positions were opened near a certain level based on false signals (which did not trigger Take Profit or the nearest target level), then all subsequent signals from this level should be ignored.
3) In a flat, any pair can form a lot of false signals or not form them at all. But in any case, at the first signs of a flat, it is better to stop trading.
4) Trade positions are opened in the time period between the beginning of the European session and until the middle of the US one, when all positions must be closed manually.
5) On the 30-minute TF, using signals from the MACD indicator, you can trade only if there is good volatility and a trend, which is confirmed by a trend line or a trend channel.
6) If two levels are located too close to each other (from 5 to 15 points), then they should be considered as an area of support or resistance.
On the chart:
Support and Resistance Levels are the Levels that serve as targets when buying or selling the pair. You can place Take Profit near these levels.
Red lines are the channels or trend lines that display the current trend and show in which direction it is better to trade now.
The MACD indicator (14,22,3) consists of a histogram and a signal line. When they cross, this is a signal to enter the market. It is recommended to use this indicator in combination with trend lines (channels and trend lines).
Important speeches and reports (always contained in the news calendar) can greatly influence the movement of a currency pair. Therefore, during their exit, it is recommended to trade as carefully as possible or exit the market in order to avoid a sharp price reversal against the previous movement.
Beginners on Forex should remember that not every single trade has to be profitable. The development of a clear strategy and money management are the key to success in trading over a long period of time.


