


Analysis of Tuesday's deals:
30M chart of the GBP/USD pair
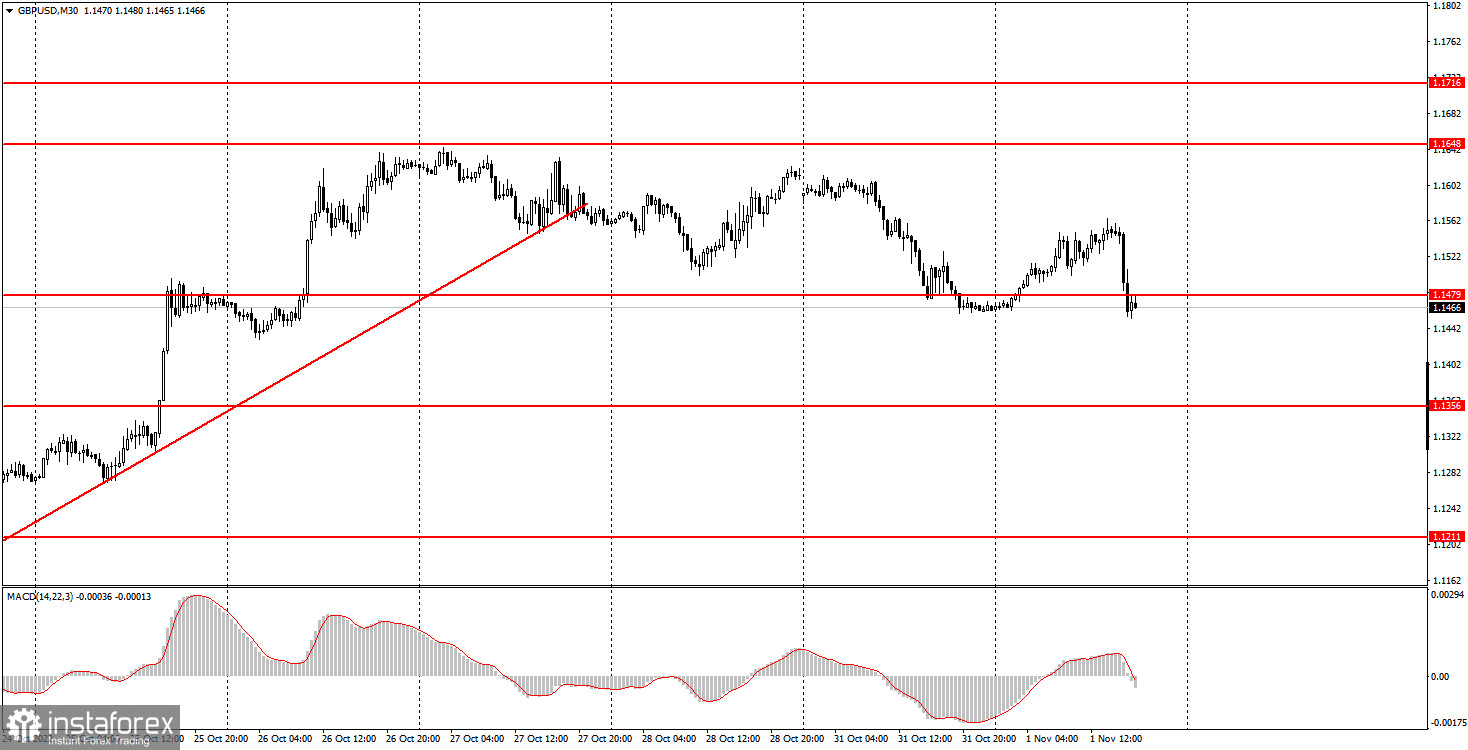
The GBP/USD pair was also in an upward movement for most of the day, but it fell after the release of US business activity indices. An index of business activity for manufacturing was also released in the UK, which was even lower than a month earlier, and amounted to 46.2 points. The market ignored this report, as the pound grew most of the day. But with the release of rather weak business activity indices in the US, the dollar was already growing. Either way, a not-too-strong downward move was seen after the price had settled below the uptrend line. From our point of view, this is logical. First, the Federal Reserve will raise the rate by another 0.75% on Wednesday, which is a serious bullish factor for the dollar. Second, we have a strong technical sell signal when the price breaks the trend line. The situation may change as early as Wednesday evening and again on Thursday afternoon. We remind you that the market's reaction after such an important event as the central bank meeting can be observed during the day completely freely. This means that the market will be trading very actively all Thursday, and sharp changes in direction of movement are possible. Be careful.
5M chart of the GBP/USD pair
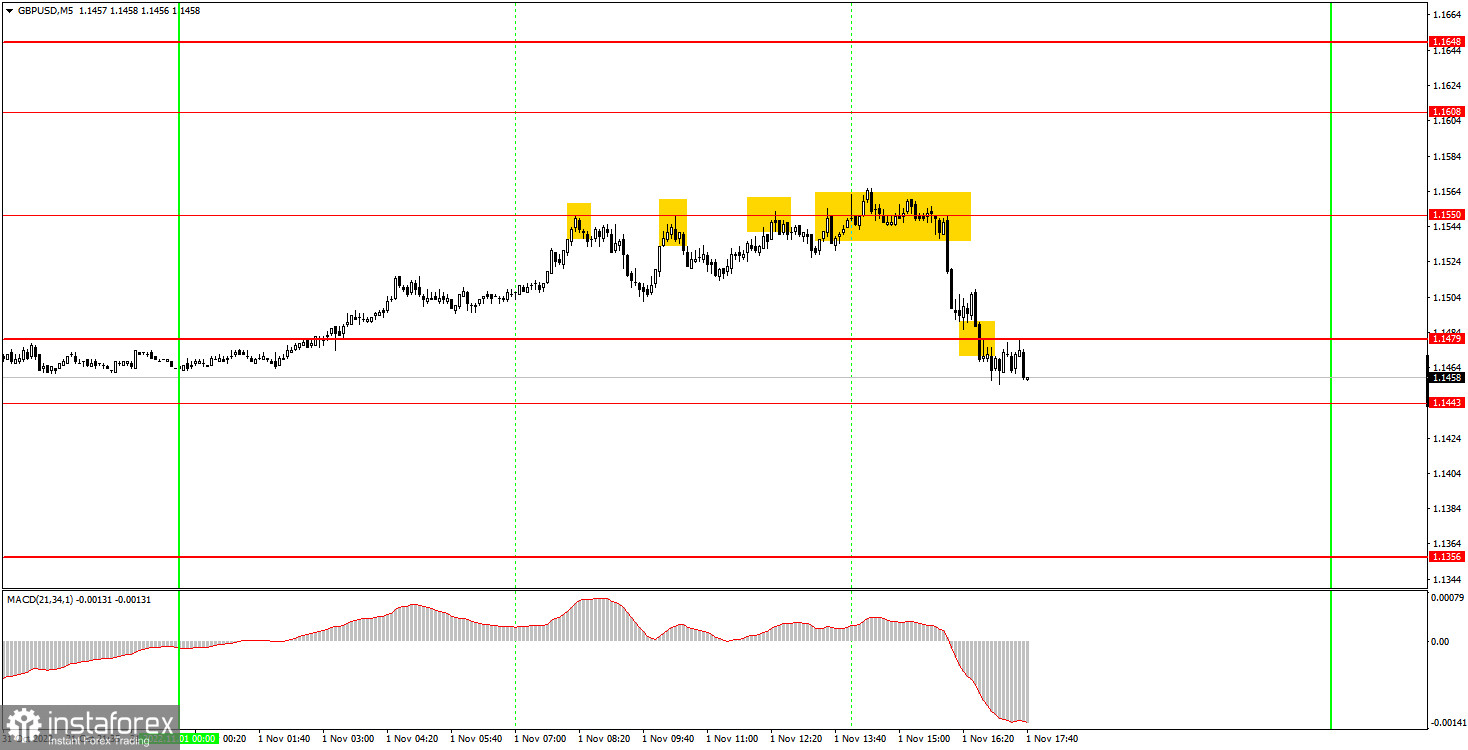
Quite a lot of trading signals were formed on the 5-minute timeframe, but most of them were not profitable. Nevertheless, let's figure out which of them should have been worked out. The first sell signal in the form of a bounce from the level of 1.1550 turned out to be false. As well as the next two. However, in the first case, Stop Loss at breakeven worked, as the price went down more than 20 points, and then returned to the level of 1.1550. Therefore, in case of a repeated bounce from 1.1550, beginners had to sell again, but the position was not closed by Stop Loss, since the Stop Loss itself was not set (20 points down were not passed). As a result, the price bounced from 1.1550 for the fourth time during the US session (under the influence of macroeconomic statistics from the US) and nevertheless began a strong fall. The 1.1479 level was overcome quite easily, and then it reached 1.1443. Short positions should have been closed around 1.1443. Profit on it amounted to at least 75 points.
How to trade on Wednesday:
The pound/dollar pair has overcome the ascending trend line and continues to move down on the 30-minute TF for now. Thus, at the moment the movement does not raise any questions, but this week we may witness several reversals and strong movements. A sharp increase in volatility is possible. On the 5-minute TF on Wednesday it is recommended to trade at the levels 1.1236, 1.1356, 1.1443, 1.1479, 1.1550, 1.1608, 1.1648, 1.1716. When the price passes after opening a position in the right direction for 20 points, Stop Loss should be set to breakeven. There are no major events scheduled for Wednesday in the UK, and only the ADP report in the US. In the evening, when the results of the Fed meeting are announced and the "flights" begin, novice traders will have to leave the market.
Basic rules of the trading system:
1) The signal strength is calculated by the time it took to form the signal (bounce or overcome the level). The less time it took, the stronger the signal.
2) If two or more positions were opened near a certain level based on false signals (which did not trigger Take Profit or the nearest target level), then all subsequent signals from this level should be ignored.
3) In a flat, any pair can form a lot of false signals or not form them at all. But in any case, at the first signs of a flat, it is better to stop trading.
4) Trade positions are opened in the time period between the beginning of the European session and until the middle of the US one, when all positions must be closed manually.
5) On the 30-minute TF, using signals from the MACD indicator, you can trade only if there is good volatility and a trend, which is confirmed by a trend line or a trend channel.
6) If two levels are located too close to each other (from 5 to 15 points), then they should be considered as an area of support or resistance.
On the chart:
Support and Resistance Levels are the Levels that serve as targets when buying or selling the pair. You can place Take Profit near these levels.
Red lines are the channels or trend lines that display the current trend and show in which direction it is better to trade now.
The MACD indicator (14,22,3) consists of a histogram and a signal line. When they cross, this is a signal to enter the market. It is recommended to use this indicator in combination with trend lines (channels and trend lines).
Important speeches and reports (always contained in the news calendar) can greatly influence the movement of a currency pair. Therefore, during their exit, it is recommended to trade as carefully as possible or exit the market in order to avoid a sharp price reversal against the previous movement.
Beginners on Forex should remember that not every single trade has to be profitable. The development of a clear strategy and money management are the key to success in trading over a long period of time.


