


Analyzing trades on Wednesday:
EUR/USD on 30M chart
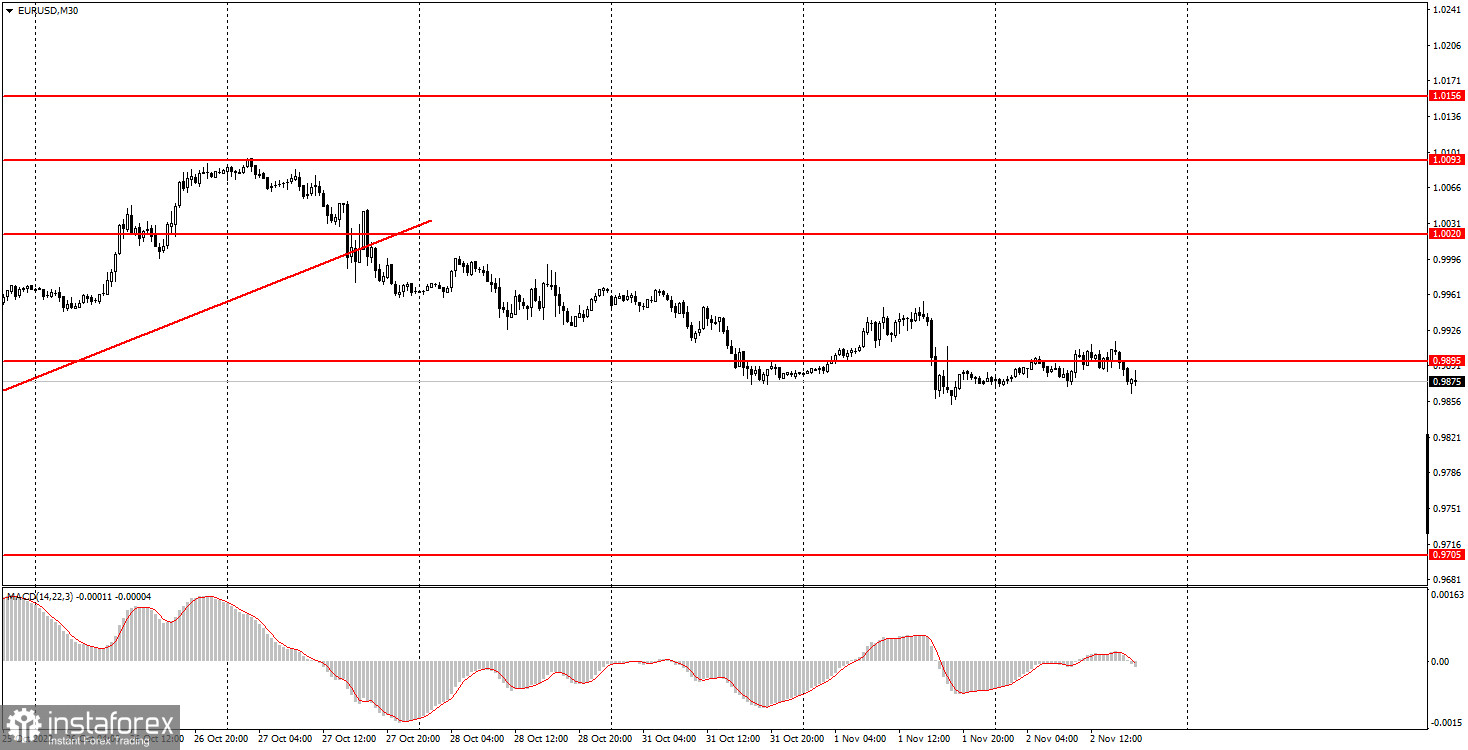
On Wednesday, EUR/USD was trading flat instead of fluctuating ahead of the Fed's meeting. The pair was stuck in the sideways channel with minimum volatility. Even the US ADP report and Manufacturing PMI in the EU could not change the situation. The volatility range was just 50 pips. This indicates that the market was cautiously waiting for the outcome of the policy meeting of the US Federal Reserve. As we mentioned earlier, the market reaction may appear later and even within the next 24 hours. So, the pair may well face volatility today in the morning and daily sessions. There was no sense in trading yesterday as the price was moving sideways, and it was hard to predict the rhetoric of the Fed members at the press conference. The question with the rate is more or less clear but Powell's statements may be surprising. It seems that the market has already priced in the rate scenario. So, anything can happen today. Formally, we still have a downtrend after a breakout of the trendline. However, on Thursday, the pair may move far away from the current price level in any direction.
EUR/USD on M5 chart
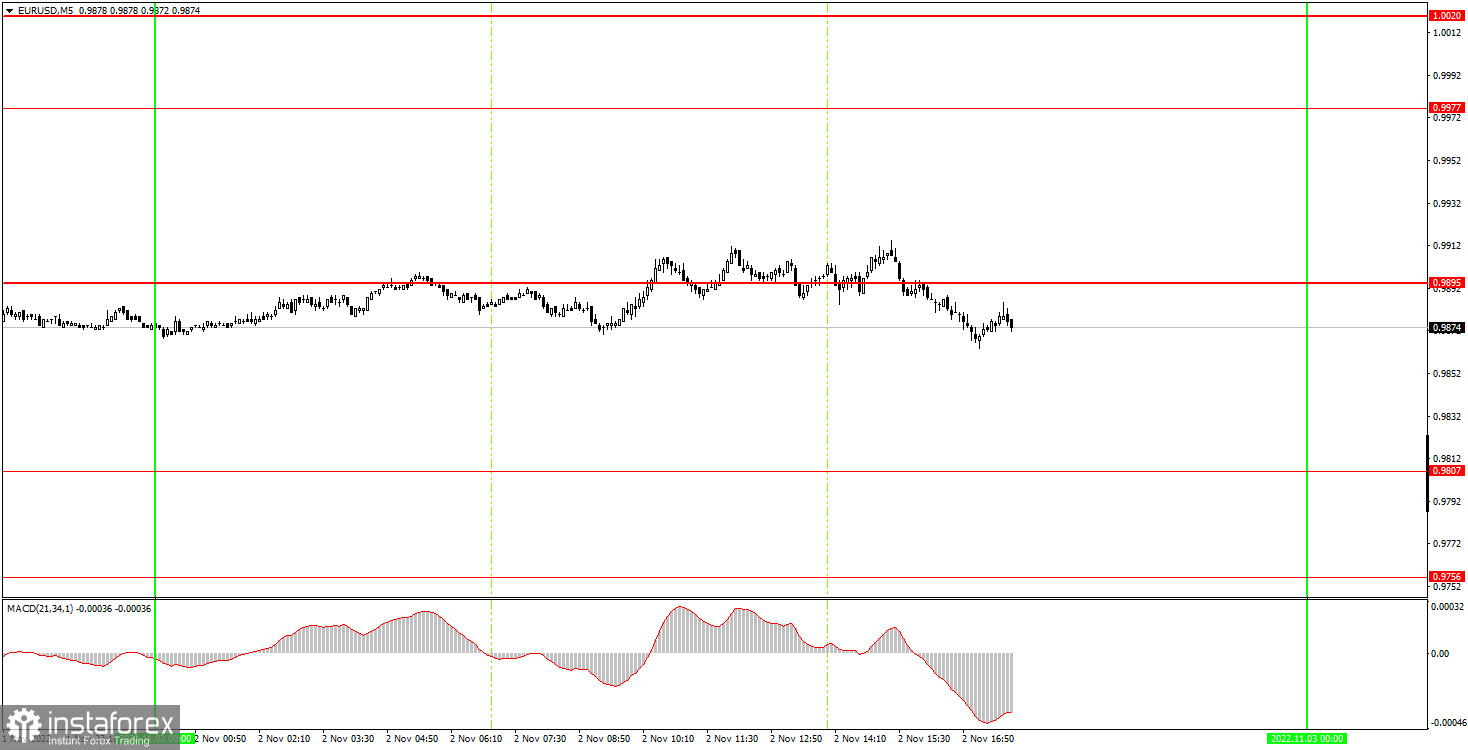
There is no sense in analyzing the 5-minute chart as the pair was trading flat for the whole day. Beginners could have followed the first signal near the level of 0.9895. Yet, this signal turned out to be false and the trade was closed only in the North American session when the pair slid below the level of 0.9895. This trade resulted in a loss. The second sell signal appeared when the price settled below the level of 0.9895 and could also be used by novice traders. The price went down by 15 pips that are necessary to set a Stop Loss. So, this time, there will be no losses. The pair may fall rapidly after the Fed announces its decision and generate good profits. It is worth taking the risk, especially given that the risk with a Stop Loss is minor.
Trading tips on Thursday
In the 30-minute time frame, the pair settled below the trendline, indicating the continuation of a decline. At the same time, the market reaction on Thursday and Friday when Nonfarm payrolls will be released can be absolutely unpredictable. The trend can change several times in these two days. On the 5-minute chart on Thursday, it is recommended to trade at the levels of 0.9709, 0.9756, 0.9807, 0.9895, 0.9977, 1.0020-1.0034, and 1.0093. As soon as the price passes 15 pips in the right direction, you should set a Stop Loss to breakeven. Today, the EU will publish the unemployment data and the US will release the ISM Manufacturing PMI. Moreover, on Thursday, the market will probably digest the results of the Fed meeting so volatility may increase and price movements could be hard to predict. Be cautious!
Basic rules of the trading system:
1) The strength of the signal is determined by the time it took the signal to form (a rebound or a breakout of the level). The quicker it is formed, the stronger the signal is.
2) If two or more positions were opened near a certain level based on a false signal (which did not trigger a Take Profit or test the nearest target level), then all subsequent signals at this level should be ignored.
3) When trading flat, a pair can form multiple false signals or not form them at all. In any case, it is better to stop trading at the first sign of a flat movement.
4) Trades should be opened in the period between the start of the European session and the middle of the US trading hours when all positions must be closed manually.
5) You can trade using signals from the MACD indicator on the 30-minute time frame only amid strong volatility and a clear trend that should be confirmed by a trendline or a trend channel.
6) If two levels are located too close to each other (from 5 to 15 pips), they should be considered support and resistance levels.
On the chart:
Support and Resistance levels are the levels that serve as targets when buying or selling the pair. You can place Take Profit near these levels.
Red lines are channels or trend lines that display the current trend and show in which direction it is better to trade now.
The MACD indicator (14, 22, and 3) consists of a histogram and a signal line. When they cross, this is a signal to enter the market. It is recommended to use this indicator in combination with trend patterns (channels and trendlines).
Important announcements and economic reports that can be found on the economic calendar can seriously influence the trajectory of a currency pair. Therefore, at the time of their release, we recommend trading as carefully as possible or exiting the market in order to avoid sharp price fluctuations.
Beginners on Forex should remember that not every single trade has to be profitable. The development of a clear strategy and money management is the key to success in trading over a long period of time.


