


Analysis of Wednesday's deals:
30M chart of the GBP/USD pair
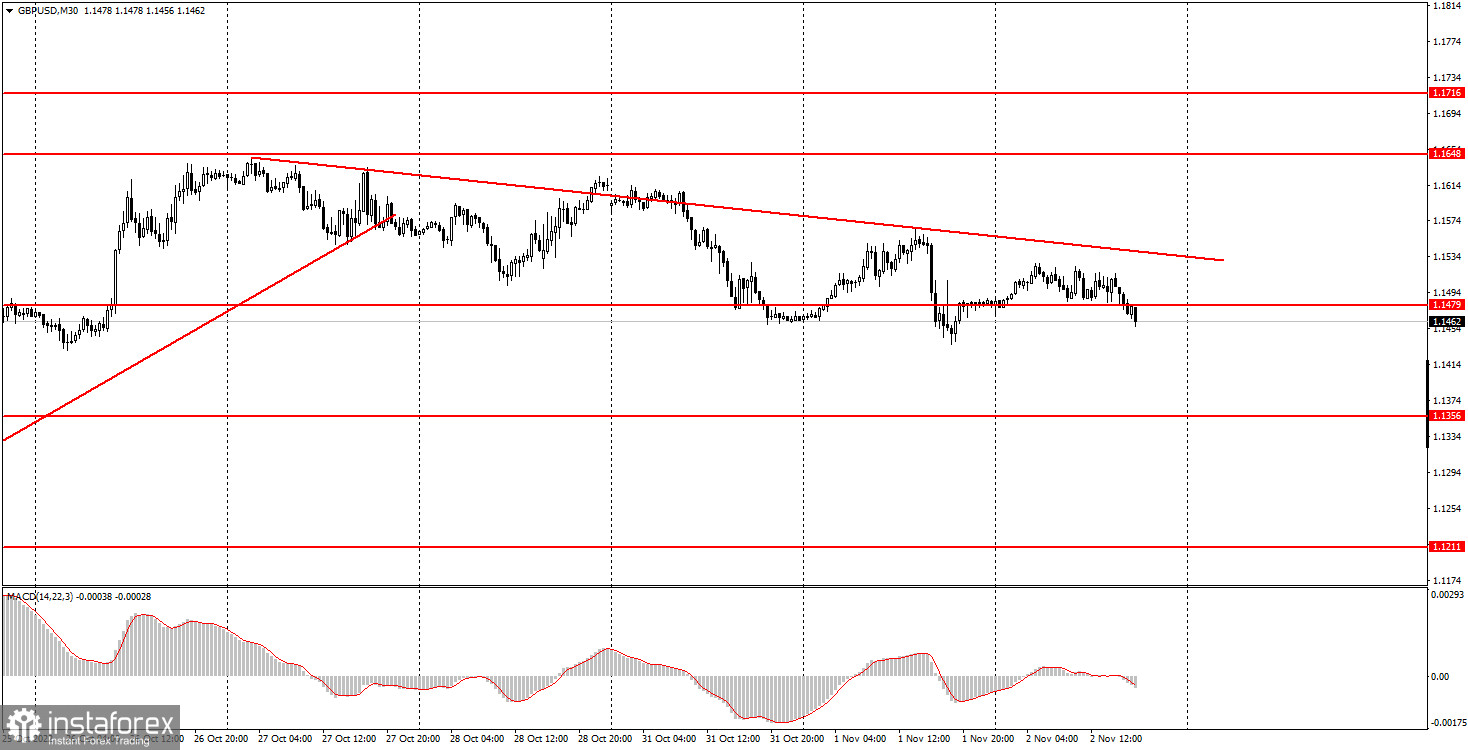
The GBP/USD pair also traded with low volatility on Wednesday. At the moment, it is only 70 points, which is very small for the pound. The market, in this case, preferred to wait for the results of the Federal Reserve meeting. There was a minimal downward bias in the current trend, which is down after breaking the uptrend line. We also built a supporting downward trend line, which is very weak and may lose its relevance. We expect that in a couple of hours the volatility will increase, and the movements may be multidirectional. At this time, there is no point in discussing the future prospects of the pair. On Wednesday - the Fed meeting, on Thursday - the Bank of England meeting, on Friday - the most important statistics in the US. By the end of the trading week, the pair can be anywhere, and it is impossible to predict the market's reaction to these events and reports. Therefore, we recommend either being very careful with trading or not trading at all in the coming days.
5M chart of the GBP/USD pair
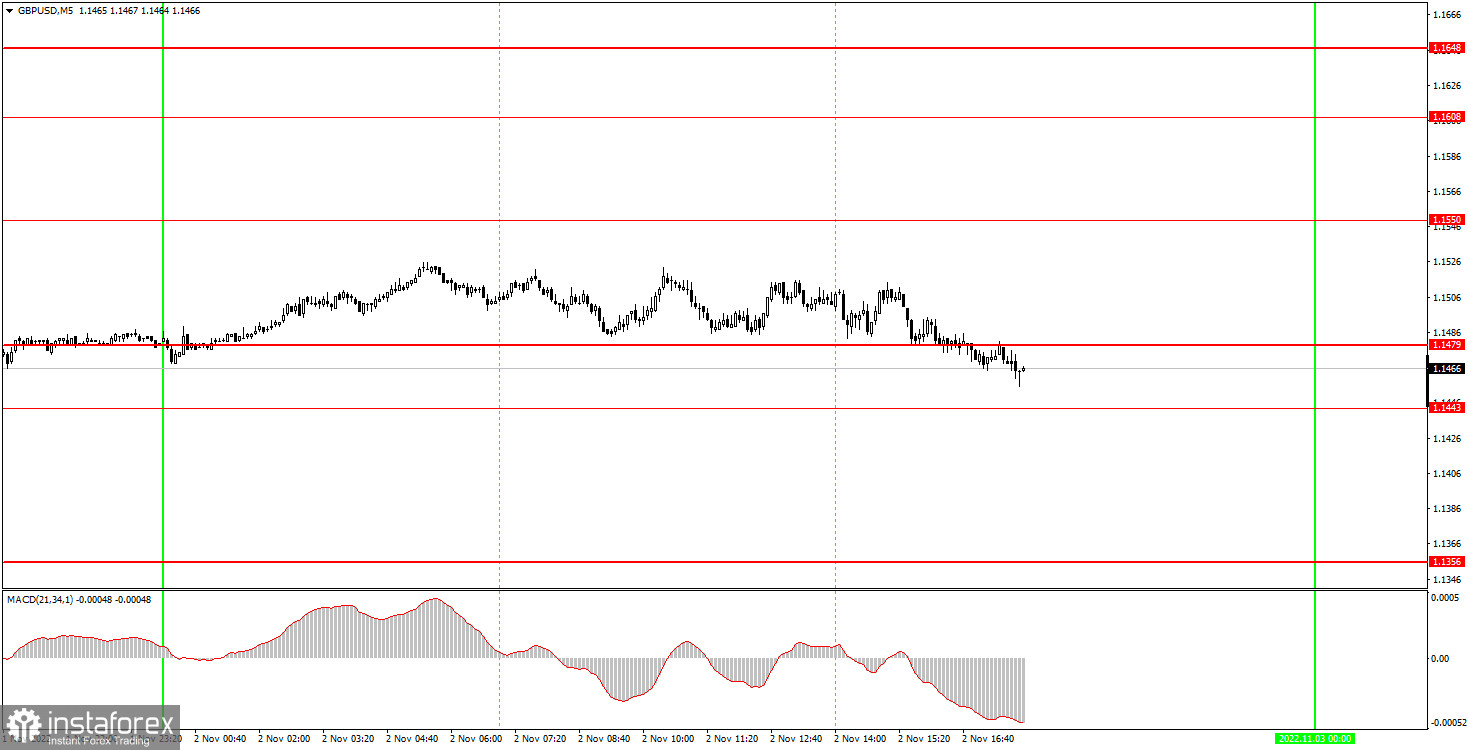
It is also clearly visible on the 5-minute timeframe that there was practically no trend movement during the day. Only at the US trading session did a semblance of a downward movement begin, but even it was extremely weak. There was a total flat at the European session. The only signal - overcoming the level of 1.1479 - was formed in the afternoon, when it became clear to everyone that there would be no trend. Therefore, novice traders should not have worked out this signal. If you try to take a risk, then you can open a short position in hopes that the pair will rush down after the announcement of the results of the Fed meeting and the press conference. However, this is risky, and in this case, beginners must decide for themselves where to place Stop Loss. There is no such situation as for the euro, where Stop Loss is already at breakeven, as for the pound.
How to trade on Thursday:
The pound/dollar pair has overcome the ascending trend line and continues to move down on the 30-minute TF for now. Thus, at the moment the movement does not raise any questions, but we may still witness several reversals and strong movements this week, so the trend can change quickly and easily. On the 5-minute TF on Thursday, the pair may trade at the following levels: 1.1236, 1.1356, 1.1443, 1.1479, 1.1550, 1.1608, 1.1648, 1.1716. When the price passes after opening a position in the right direction for 20 points, Stop Loss should be set to breakeven. The UK is set to announce the results of the BoE meeting, as well as the release of business activity indices. Naturally, the indices will be in the shadow of the BoE meeting. On the other hand, we will receive a report on business activity in the ISM services sector in America in the afternoon. In addition, traders can continue to work out the results of the Fed meeting.
Basic rules of the trading system:
1) The signal strength is calculated by the time it took to form the signal (bounce or overcome the level). The less time it took, the stronger the signal.
2) If two or more positions were opened near a certain level based on false signals (which did not trigger Take Profit or the nearest target level), then all subsequent signals from this level should be ignored.
3) In a flat, any pair can form a lot of false signals or not form them at all. But in any case, at the first signs of a flat, it is better to stop trading.
4) Trade positions are opened in the time period between the beginning of the European session and until the middle of the US one, when all positions must be closed manually.
5) On the 30-minute TF, using signals from the MACD indicator, you can trade only if there is good volatility and a trend, which is confirmed by a trend line or a trend channel.
6) If two levels are located too close to each other (from 5 to 15 points), then they should be considered as an area of support or resistance.
On the chart:
Support and Resistance Levels are the Levels that serve as targets when buying or selling the pair. You can place Take Profit near these levels.
Red lines are the channels or trend lines that display the current trend and show in which direction it is better to trade now.
The MACD indicator (14,22,3) consists of a histogram and a signal line. When they cross, this is a signal to enter the market. It is recommended to use this indicator in combination with trend lines (channels and trend lines).
Important speeches and reports (always contained in the news calendar) can greatly influence the movement of a currency pair. Therefore, during their exit, it is recommended to trade as carefully as possible or exit the market in order to avoid a sharp price reversal against the previous movement.
Beginners on Forex should remember that not every single trade has to be profitable. The development of a clear strategy and money management are the key to success in trading over a long period of time.


