


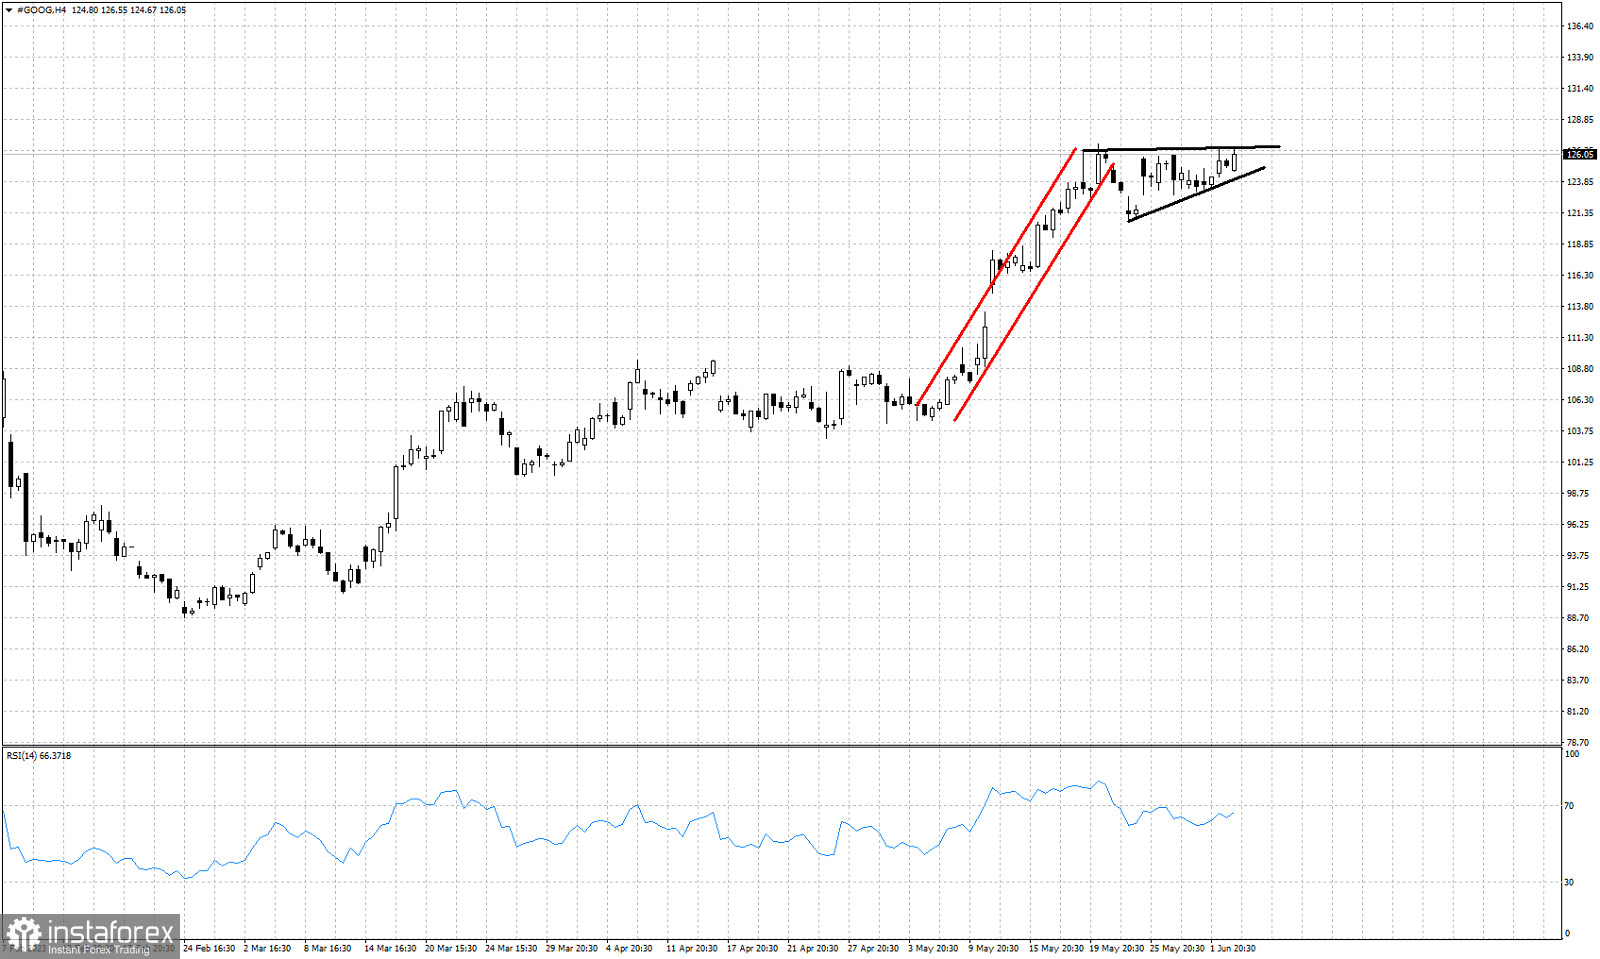
Red lines - bullish channel
Black lines- ascending triangle pattern
GOOG stock price remains in a bullish trend making higher highs and higher lows. In previous posts we talked extensively about the upside potential targets following our April and May analysis. Short-term price action suggests that another bullish formation is in the making and GOOG stock price could continue its upward move towards $132 at least. GOOG stock price has formed an ascending triangle pattern after the bullish channel price was in. This is a continuation pattern and when price breaks above $127 on a daily closing basis, we will get a new bullish signal targeting at least $132. Traders should not forget to check the RSI for any possible bearish divergence warning. Support is at $123. Bulls do not want to see price break below this level.


