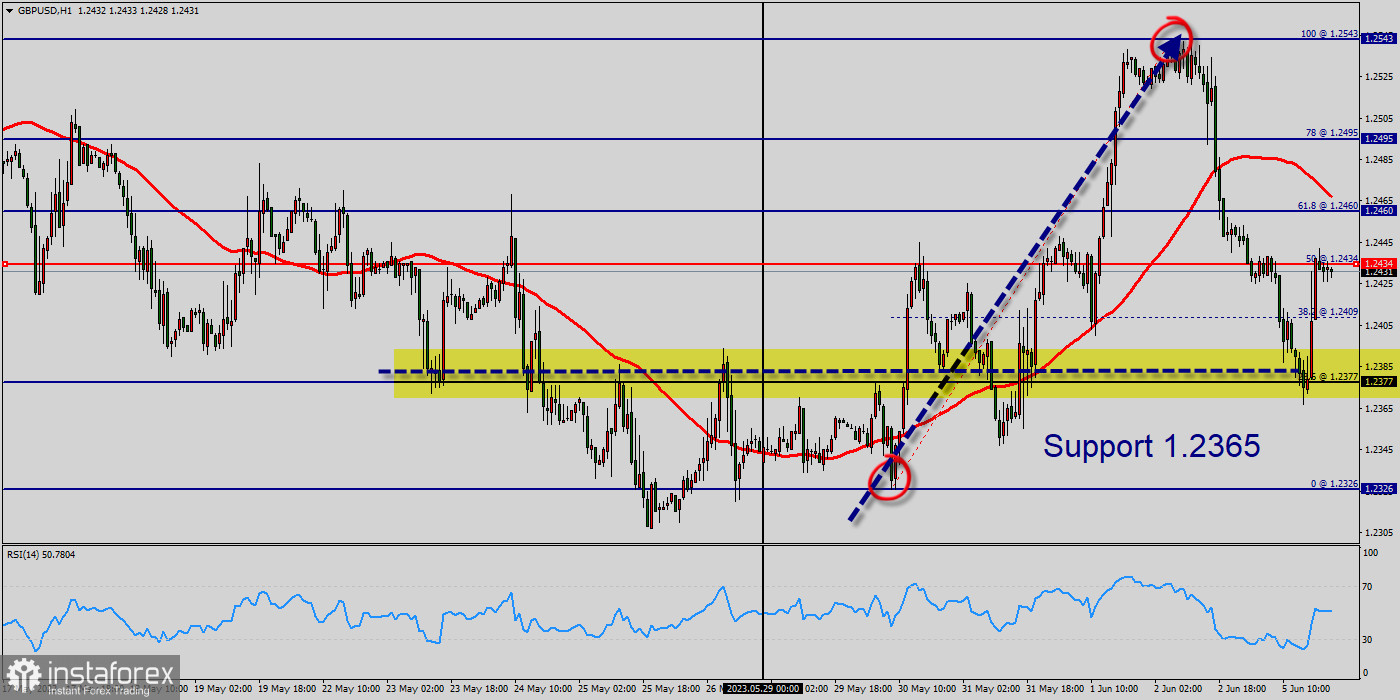
The GBP/USD pair broke resistance which turned to strong support at the level of 1.2377 yesterday. The level of 1.2377 coincides with a golden ratio (23.6% of Fibonacci), which is expected to act as major support today.
The Relative Strength Index (RSI) is considered overbought because it is above 55.
The RSI is still signaling that the trend is upward as it is still strong above the moving average (100). This suggests the pair will probably go up in coming hours.
Accordingly, the market is likely to show signs of a bullish trend. In other words, buy orders are recommended above 1.2377 with the first target at the level of 1.2434. From this point, the pair is likely to begin an ascending movement to the point of 1.0212 and further to the level of 1.2434.
Consequently, the first support is set at the level of 1.2377. So, the market is likely to show signs of a bullish trend around the spot of 1.2377/1.2380.
If the GBP/USD pair succeed to break through the resistance level of 1.2434, the market will scaling further to 1.2460.
This would suggest a bullish market because the RSI indicator is still in a positive area and does not show any trend-reversal signs. The pair is expected to drop higher towards at least 1.2460 with a view to test the daily pivot point.
The level of 1.2543 will act as strong resistance and the double top is already set at the point of 1.2543.
On the other hand, if a breakout happens at the support level of 1.2377, then this scenario may become invalidated.


