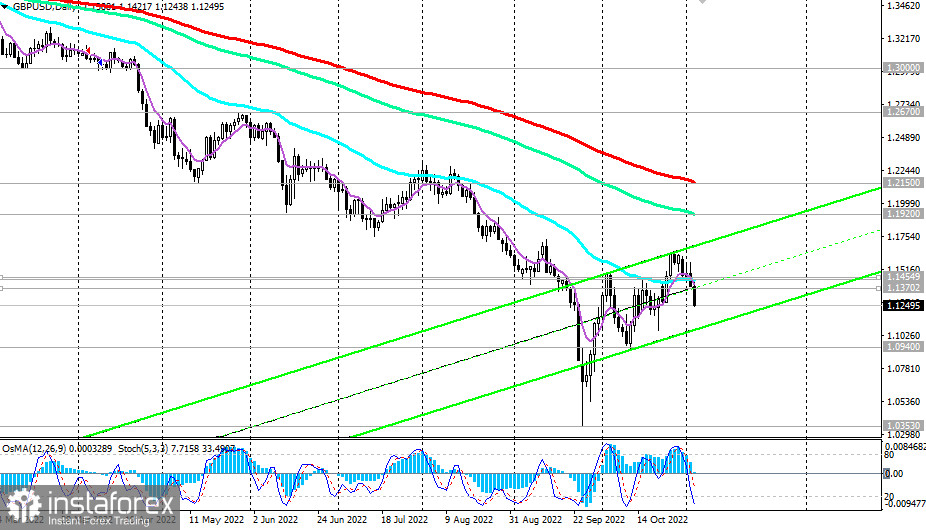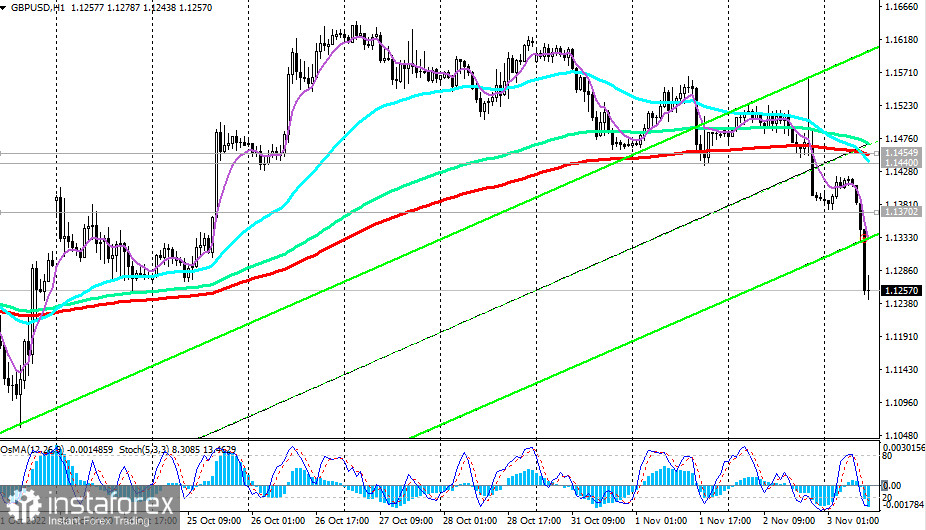
As of writing, GBP/USD is trading near 1.1250, having fallen sharply at the start of today's European trading session. Yesterday, the price broke through two important short-term support levels 1.1455 (200 EMA on the 1-hour chart), 1.1370 (200 EMA on the 4-hour chart GBP/USD), confirming the pair's return to the bear market zone.

If the results of today's meeting of the Bank of England really disappoint market participants, then the GBP/USD pair risks falling even lower, heading towards the September lows and the 1.0353 mark.
The nearest support for GBP/USD is at 1.1080 (lower line of the rising channel on the daily chart), 1.0940 (local October low).
Their breakdown will confirm our assumption.

In an alternative scenario, the signal for the resumption of long positions will be a breakout of the resistance level 1.1455, which can also provoke a further corrective growth of the GBP/USD up to the resistance levels 1.1640 (local October high), 1.1920 (144 EMA on the daily chart).
Further growth looks unlikely so far, while the US dollar is in the zone of highs of the last 20 years. In general, the downward dynamics of the GBP/USD remains, making short positions preferable.
Support levels: 1.1200, 1.1100, 1.1080, 1.0940
Resistance levels: 1.1370, 1.1440, 1.1455, 1.1640, 1.1900, 1.1920, 1.2150
Trading Tips
Sell by market. Stop Loss 1.1380. Take-Profit 1.1200, 1.1100, 1.1080, 1.0940, 1.0900, 1.0800, 1.0700, 1.0600, 1.0500, 1.0400, 1.0353
Buy Stop 1.1380. Stop-Loss 1.1230. Take-Profit 1.1440, 1.1455, 1.1640, 1.1900, 1.1920, 1.2150


