


Analysis of Thursday's deals:
30M chart of the EUR/USD pair
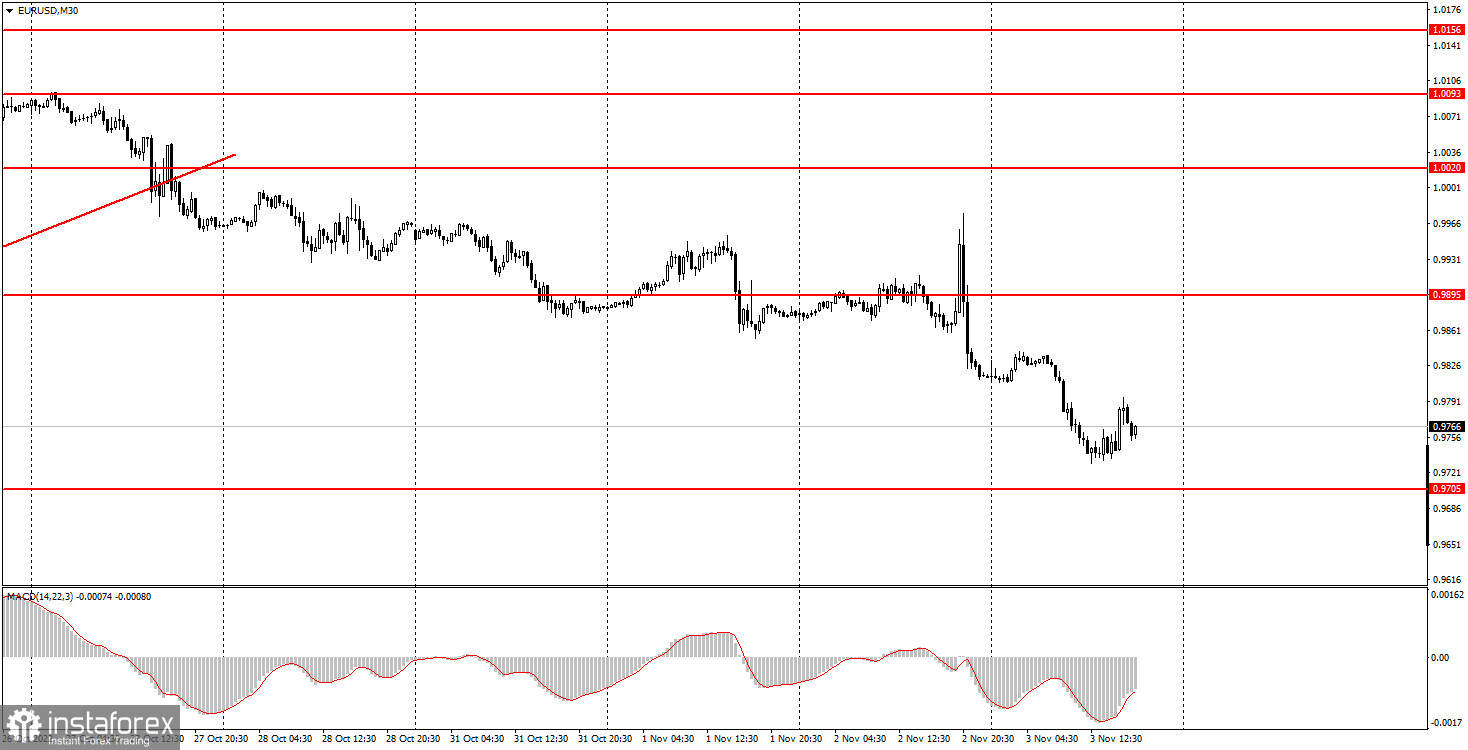
The EUR/USD currency pair continued to trade rather volatilely and with a downward movement. Recall that the euro started falling about a week ago. It dropped after the announcement of the results of the Federal Reserve meeting on Wednesday, and continued to do so on Thursday. Of course, we saw the pair move in different directions on Wednesday evening, but we already warned novice players about this. The rate rose by 0.75%, and Fed Chairman Jerome Powell assured at a press conference that it would continue to rise, perhaps at a slower pace than in the last four meetings. Thus, the dollar rose absolutely logically. We believed that the final growth of the euro/dollar pair was possible, since the market had enough time to work out the rate hike in advance, but still few expected that Powell would be so hawkish, which played an important role in the strengthening of the US currency. Thus, although there is no descending trend line now, the trend is clearly downward, and the pair is again approaching its lows over the past 20 years. The likelihood of a long-term downward trend is greater than ever.
5M chart of the EUR/USD pair
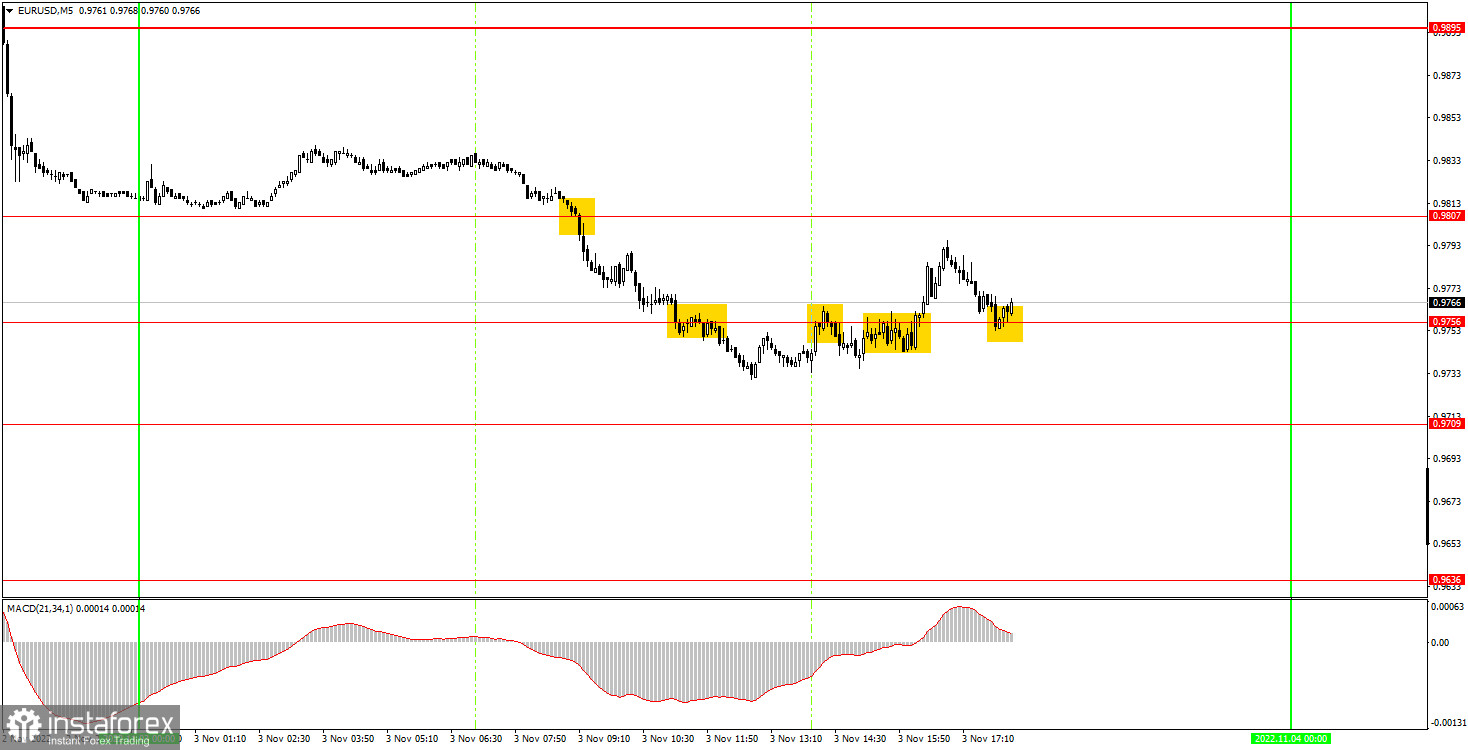
There were plenty of trading signals on the 5-minute timeframe. We warned you that the market may continue to work out the results of the Fed meeting the next day. And so it happened. The euro fell at the opening of the European trading session, and beginners could earn on the first sell signal near the level of 0.9807. The price then overcame the level of 0.9756, but it could not continue the fall in the US session, since Americans had the opportunity to work out the results of the Fed meeting. A correction began, within which the price settled above 0.9756, and short positions should have been closed on this buy signal. Profit was about 30 points. The buy signal could also be worked out, but it was closed by Stop Loss at breakeven, as the price was able to go 20 points up, but not reach the target level of 0.9807.
How to trade on Friday:
The pair continues its downward movement on the 30-minute timeframe, and the current week is not over yet! The most important statistics in the US will be published on Friday, which may contribute to the dollar's growth, or may reverse the local trend upwards. In general, we expect the pair to fall further, but everything will depend on the nature of reports from overseas. On the 5-minute TF, it is recommended to trade at the levels of 0.9554, 0.9636, 0.9709, 0.9756, 0.9807, 0.9895, 0.9977. When passing 15 points in the right direction, you should set Stop Loss to breakeven. The European Union will publish the index of business activity in the services sector and European Central Bank President Christine Lagarde will deliver a speech. Meanwhile, we have the reports on nonfarm and unemployment in the US. Thus, there will be plenty of important statistics and events. Volatility may remain high.
Basic rules of the trading system:
1) The signal strength is calculated by the time it took to form the signal (bounce or overcome the level). The less time it took, the stronger the signal.
2) If two or more positions were opened near a certain level based on false signals (which did not trigger Take Profit or the nearest target level), then all subsequent signals from this level should be ignored.
3) In a flat, any pair can form a lot of false signals or not form them at all. But in any case, at the first signs of a flat, it is better to stop trading.
4) Trade positions are opened in the time period between the beginning of the European session and until the middle of the US one, when all positions must be closed manually.
5) On the 30-minute TF, using signals from the MACD indicator, you can trade only if there is good volatility and a trend, which is confirmed by a trend line or a trend channel.
6) If two levels are located too close to each other (from 5 to 15 points), then they should be considered as an area of support or resistance.
On the chart:
Support and Resistance Levels are the Levels that serve as targets when buying or selling the pair. You can place Take Profit near these levels.
Red lines are the channels or trend lines that display the current trend and show in which direction it is better to trade now.
The MACD indicator (14,22,3) consists of a histogram and a signal line. When they cross, this is a signal to enter the market. It is recommended to use this indicator in combination with trend lines (channels and trend lines).
Important speeches and reports (always contained in the news calendar) can greatly influence the movement of a currency pair. Therefore, during their exit, it is recommended to trade as carefully as possible or exit the market in order to avoid a sharp price reversal against the previous movement.
Beginners on Forex should remember that not every single trade has to be profitable. The development of a clear strategy and money management are the key to success in trading over a long period of time.


