


Trend analysis (Fig. 1).
The euro-dollar pair may move downward from 1.0020 (close of yesterday's daily candle) to 0.9961, the 23.6% retracement level (red dotted line). Upon reaching this level, an upward movement is possible to 1.0040, the 76.4% retracement level (blue dotted line). When testing this level, the price may continue to move upward to 1.0100, the 85.4% retracement level (blue dotted line). From this level, a downward pullback is possible.
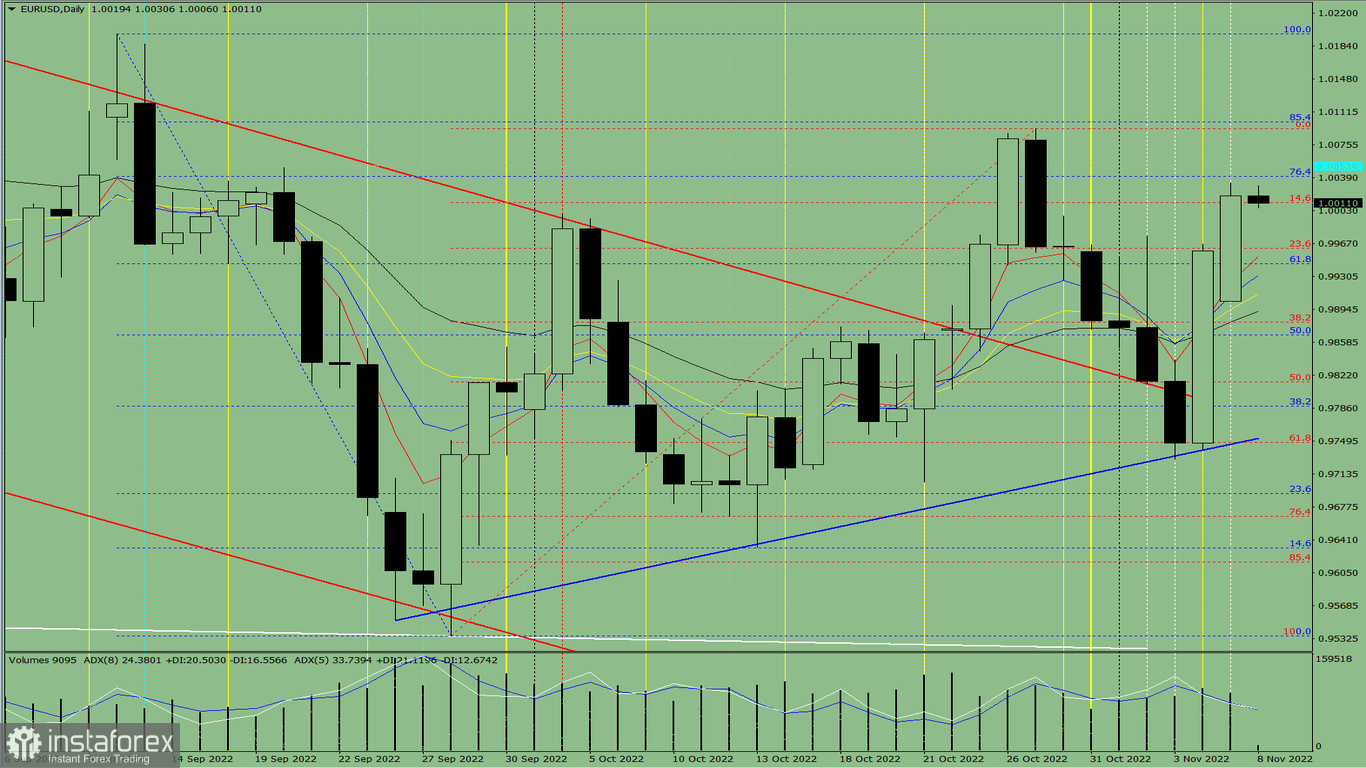
Fig. 1 (daily chart).
Comprehensive analysis:
- indicator analysis - down;
- Fibonacci levels - down;
- volumes - up;
- candlestick analysis - up;
- trend analysis - up;
- Bollinger bands - up;
- weekly chart - up.
General conclusion:
Today, the price may move downward from 1.0020 (close of yesterday's daily candle) to 0.9961, the 23.6% retracement level (red dotted line). Upon reaching this level, an upward movement is possible to 1.0040, the 76.4% retracement level (blue dotted line). When testing this level, the price may continue to move upward to 1.0100, the 85.4% retracement level (blue dotted line). From this level, a downward pullback is possible.
Alternatively, the price may move upward from the level of 1.0020 (close of yesterday's daily candle) to 1.0100, the 85.4% retracement level (blue dotted line). When testing this level, a downward movement is possible to 1.0052, the historical support level (blue dotted line). From this level, the price may move up.


