


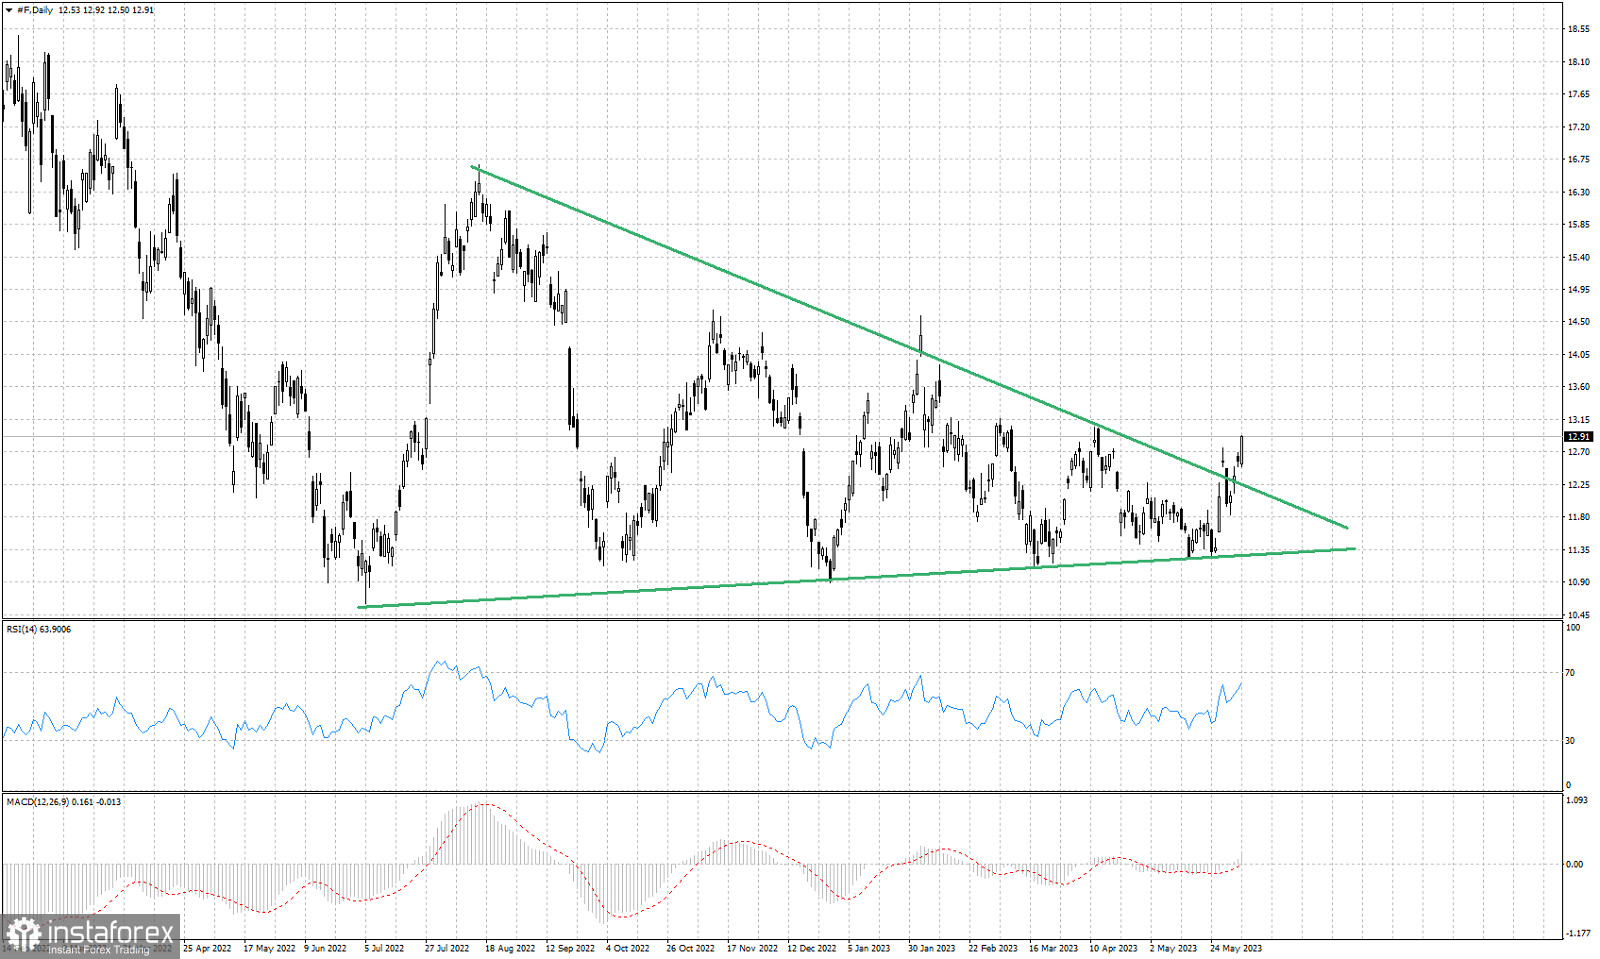
Green lines- triangle pattern
Ford stock price is trading around $12.90. As we have mentioned in previous posts, price had formed a triangle pattern since June 2022. Price has now provided us with a bullish break out as price has moved above the upper triangle boundary. Price formed a higher low at $11.24 and is making higher highs and higher lows since then. Previous resistance at $12.24 is now support. It would be a bad sign if price were to pull back below this price level. With the RSI above 50, there is a positive momentum currently in the stock, making us expect higher prices.


