


Analysis of Wednesday's deals:
30M chart of the GBP/USD pair
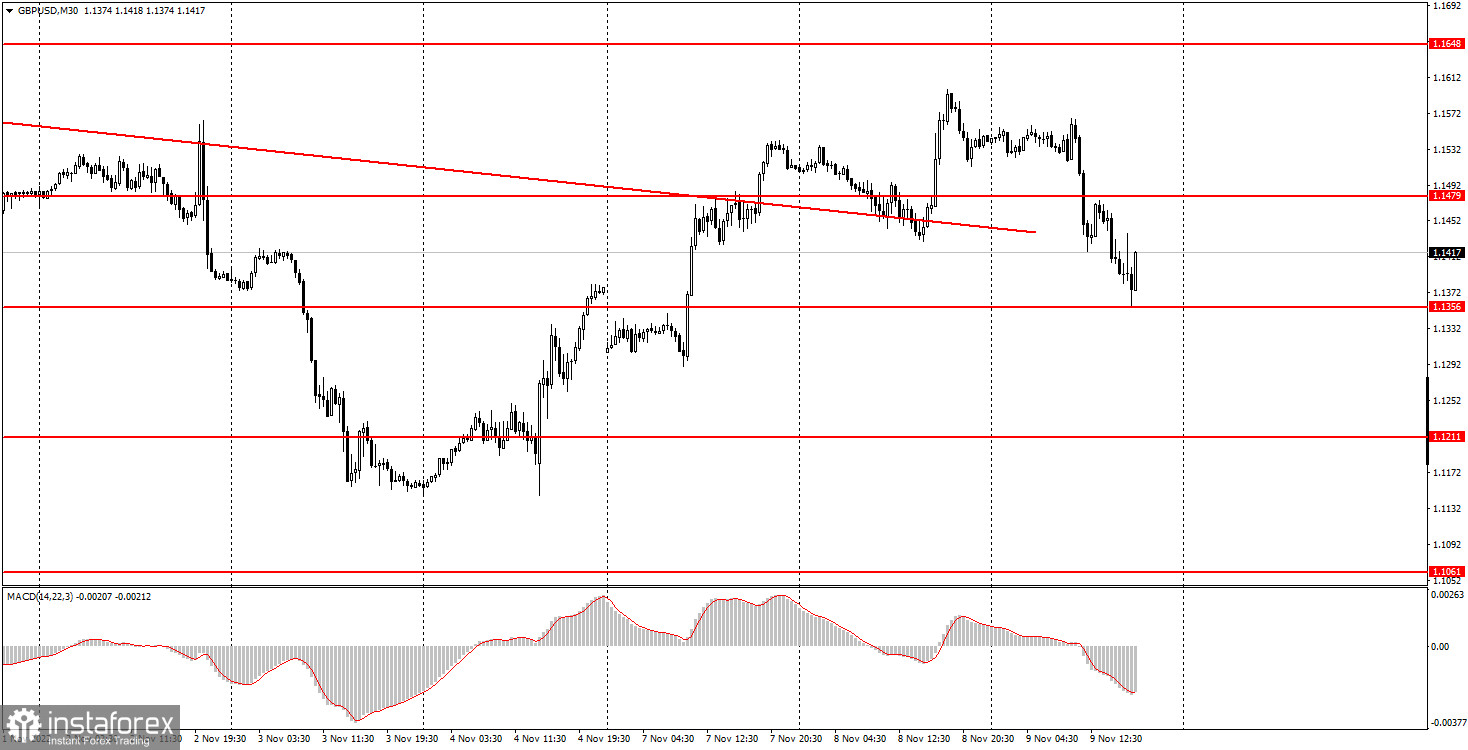
The GBP/USD pair started a rather powerful fall on Wednesday, which is already in line with the real fundamental and macroeconomic picture. Recall that we consider the pound's growth in the last few days absolutely illogical and unreasonable. If we are right, then the downward movement has now begun to offset the injustice. There was not a single significant event on Wednesday, nor Tuesday, nor on Monday in the UK and the US that could be attributed to the movement of the pound/dollar pair. Moreover, on Monday, the pair's quotes settled above the descending trend line, and it went below this line on Wednesday. Everything goes to the fact that on higher timeframes we will see "swings", and on lower timeframes these will be trends for 3-4 days. The US currency may continue to grow on Thursday if the US inflation report turns out to be weak. The consumer price index should slow down a bit so that the market finds grounds to buy the dollar. To be clear, the weaker inflation falls (or does not fall at all), the higher the likelihood of a longer and stronger tightening of the Federal Reserve's monetary policy becomes, which is always good for the dollar.
5M chart of the GBP/USD pair
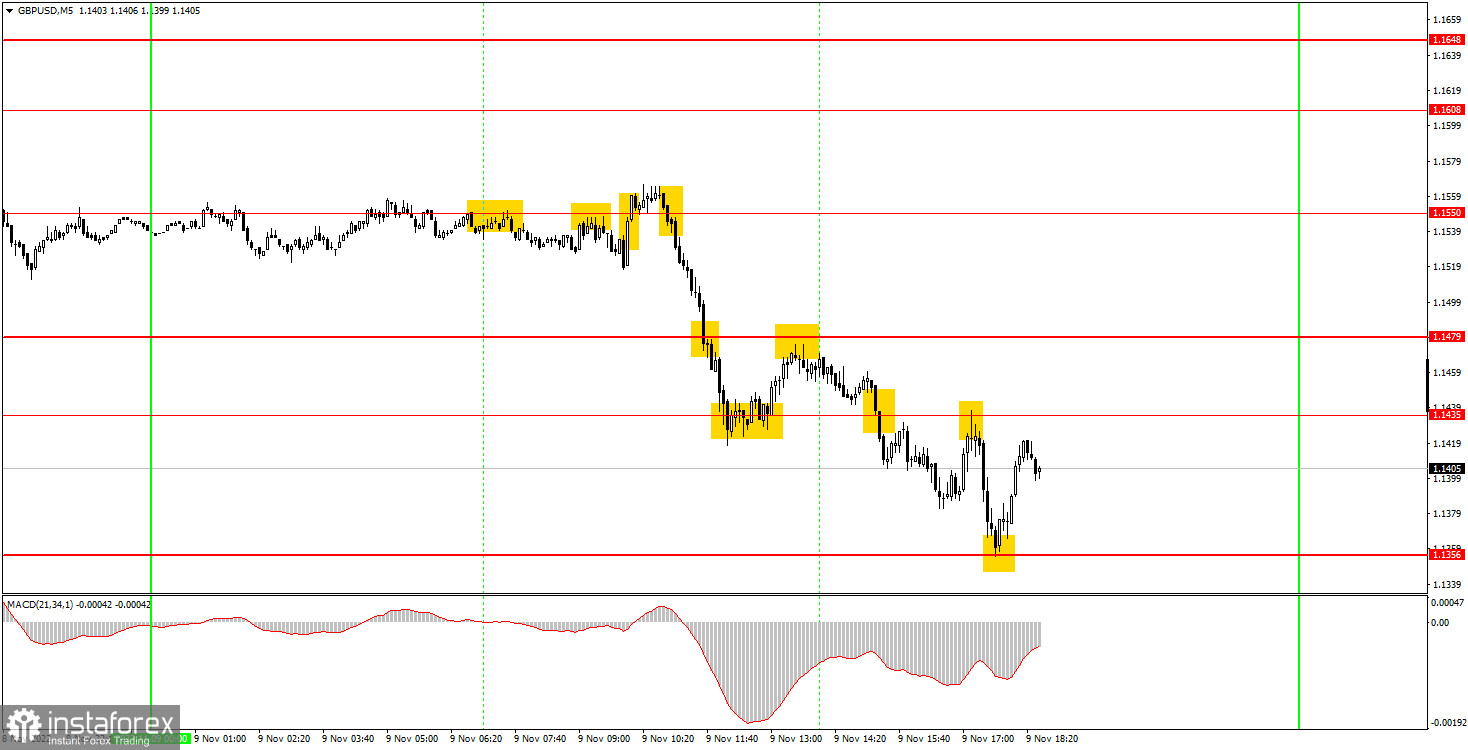
There were plenty of trading signals on the 5-minute timeframe on Wednesday. Let's try to figure them out. First, the price bounced twice from the 1.1550 level. Neither in the first nor in the second case, it could not go down even 20 points. Therefore, the short position closed at a loss when the price moved above 1.1550. This departure could be regarded as a signal to buy, but it also turned out to be false and also closed at a loss. The third signal near the 1.1550 level turned out to be correct, but it just shouldn't have been worked out, since the first two signals were false. As a result, the next signal was only near the level of 1.1479. The price overcame it and dropped to 1.1435, so there was a profit of about 15 pips. Further, the price rebounded from 1.1435, traders should have opened longs, but in this case, they failed to make a profit, as the price did not reach the target level of 1.1479 by 4 points and returned back to 1.1435. The next sell signal is also false, but we managed to place a Stop Loss on it, as the pair went down more than 20 points. New a sell signal near 1.1435 and this time 42 pips profit as the pair hit the 1.1356 target perfectly. The last signal was formed too late in time, but was profitable. As a result, novice traders could end Wednesday by gaining a small profit.
How to trade on Thursday:
The pound/dollar pair maintains a downward trend on the 30-minute TF, but the whole movement already looks like a "swing". This week there was no fundamental or other background, however, the pair does not stand still and is traded rather volatilely. We expect a new fall in the pound. On the 5-minute TF on Thursday it is recommended to trade at the levels of 1.1146, 1.1200-1.1211-1.1236, 1.1356, 1.1435, 1.1479, 1.1550, 1.1608, 1.1648. When the price passes after opening a position in the right direction for 20 points, Stop Loss should be set to breakeven. No important reports or other events scheduled for Thursday in the UK, but the inflation report will be released in the United States, which will become the "principle of the day". The pair may continue to trade in a very volatile and trendy manner.
Basic rules of the trading system:
1) The signal strength is calculated by the time it took to form the signal (bounce or overcome the level). The less time it took, the stronger the signal.
2) If two or more positions were opened near a certain level based on false signals (which did not trigger Take Profit or the nearest target level), then all subsequent signals from this level should be ignored.
3) In a flat, any pair can form a lot of false signals or not form them at all. But in any case, at the first signs of a flat, it is better to stop trading.
4) Trade positions are opened in the time period between the beginning of the European session and until the middle of the US one, when all positions must be closed manually.
5) On the 30-minute TF, using signals from the MACD indicator, you can trade only if there is good volatility and a trend, which is confirmed by a trend line or a trend channel.
6) If two levels are located too close to each other (from 5 to 15 points), then they should be considered as an area of support or resistance.
On the chart:
Support and Resistance Levels are the Levels that serve as targets when buying or selling the pair. You can place Take Profit near these levels.
Red lines are the channels or trend lines that display the current trend and show in which direction it is better to trade now.
The MACD indicator (14,22,3) consists of a histogram and a signal line. When they cross, this is a signal to enter the market. It is recommended to use this indicator in combination with trend lines (channels and trend lines).
Important speeches and reports (always contained in the news calendar) can greatly influence the movement of a currency pair. Therefore, during their exit, it is recommended to trade as carefully as possible or exit the market in order to avoid a sharp price reversal against the previous movement.
Beginners on Forex should remember that not every single trade has to be profitable. The development of a clear strategy and money management are the key to success in trading over a long period of time.


