


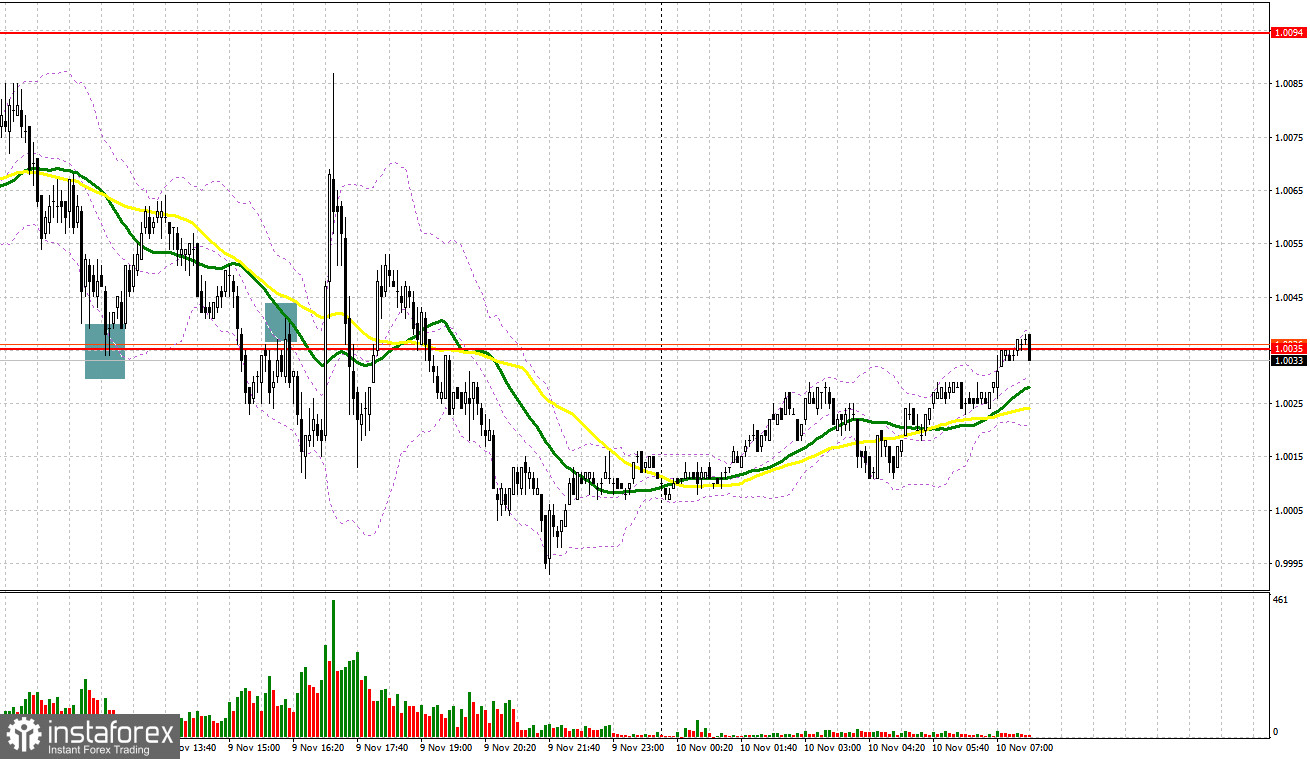
Yesterday, traders received several interesting signals to enter the market. Let us take a look at the 5-minute chart to figure out what happened. Earlier, I asked you to pay attention to 1.0035 to decide when to enter the market. A decline and false breakout of this level provided bulls with a perfect entry point, but after moving up by 30 points, the correction ended. In the afternoon, we could observe a breakdown of 1.0035 and the reverse test upwards, which already led to a sell signal. The downward movement was about 25 points.
When to go long on EUR/USD:
The pair is going to face a very volatile day today, as quite important statistics regarding the US economy is expected in the afternoon. As for the European session, everything should go smoothly here. I advise you to pay attention to the economic bulletin from the European Central Bank and to the speech of the member of the executive board of the ECB, Isabelle Schnabel. In order for bulls not to lose the initiative in the current conditions, it is necessary to go above 1.0035, which will not be easy to do, since at any moment the pressure on risky assets may increase. A more optimal scenario for buying the euro would be a false breakout near the nearest support of 0.9975.
After that you can open long positions in order to continue the bullish trend observed since last Friday. A breakout and test from 1.0035 downwards , where the moving averages play on the bears' side, will open a direct path to the weekly high of 1.0083, and there, very close to 1.0136, a more significant level, where bears should prove themselves, if they really remained. Surpassing this level, which can only occur if inflationary pressures in the US ease, will hit the bears' stop orders and form another buy signal with the possibility of pushing the pair to the 1.0182 area, which will strengthen the bullish trend.
If the pair falls and bulls fail to protect 0.9975, then the pair will be under pressure, leading to a downward move towards 0.9928. The best decision to buy would be a false breakout in that level. It is also possible to go long after a bounce from 0.9887, or even lower - from 0.9837, expecting a rise of 30-35 pips.
When to go short on EUR/USD:
Yesterday, the bears tried to return to the market and they did it pretty well. Now you need to prove yourself in the area of the nearest resistance at 1.0035, which acted as support and from which several good signals were formed to enter the market. The Republicans' expected victory will continue to put pressure on the US dollar, but, as I noted above, everyone is currently focused on US inflation data. The optimal scenario for opening short positions would be a false breakout at the resistance area of 1.0035, which will provide an excellent entry point and make it possible for the pair to go down to support 0.9975.
Settling below this range will occur only if we receive a weak economic bulletin from the ECB. A reverse upward test of 0.9975 will be a reason to sell EUR/USD with the goal of removing bullish stops and a larger fall to the 0.9928 area, where bears will face serious problems, as a rather strong downward correction will return big buyers to the market. The farthest target will be 0.9887, where I recommend locking in profits.
If EUR/USD moves up during the European session and bears fail to protect 1.0035, the demand for the pair will increase, which will support the bull market and an update of 1.0083. In this case, I advise you not to rush into selling: I recommend opening shorts there only after a false breakout. It is also possible to go short after a rebound from the high of 1.0136, or even higher - from 1.0182, expecting a decline of 30-35 pips.
COT report:
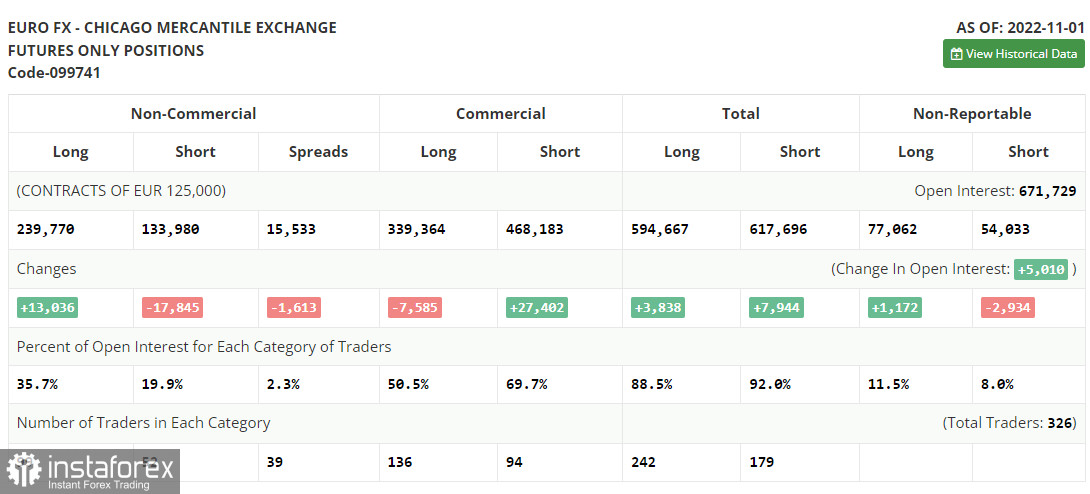
According to the recent Commitment of Traders (COT) report from November 1, the number of both short and long positions dropped. The US dollar continues losing value against risk assets despite the fact that the US Fed remains stuck to its approach. Most traders suppose that the regulator will end its aggressive tightening as early as next spring. After that, it is likely to start cutting the key interest rate quite smoothly. This may considerably boost demand for the euro. This week, such a rise could be triggered by the US inflation report, which has been shaping the Fed's approach. If inflation declines, the US dollar will lose value and the euro will confidently consolidate above the parity level. However, the bullish potential of the euro is also limited. The fact is that the ECB may revise its aggressive monetary policy after a sharp rise in the key interest rate. However, this will happen if the eurozone economy continues contracting. The COT report unveiled that the number of long non-commercial positions increased by 13,036 to 239,770, while the number of short positions dropped by 17,845 to 133,980. At the end of the week, the total non-commercial net position remained positive at 105,790 against 74,909. This indicates that investors continue benefiting from the situation and buying the cheap euro below parity, as well as accumulating long positions, expecting the end of the crisis. The weekly closing price rose to 0.9918 from 1.0000.
Signals of indicators:
Moving averages
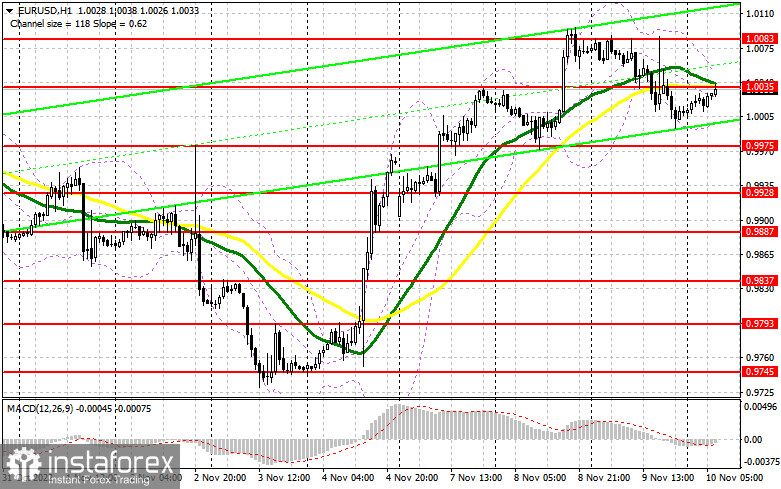
Trading is performed below the 30- and 50-day moving averages, which indicates a return to market equilibrium.
Note: The period and prices of moving averages are considered by the author on the one-hour chart, which differs from the general definition of the classic daily moving averages on the daily chart.
Bollinger Bands
If the euro/dollar pair rises, the upper limit of the indicator located at 1.0040 will act as resistance. If the pair drops, the lower limit of the indicator around 1.0000 will act as support.
Description of indicators
- Moving average (moving average, determines the current trend by smoothing volatility and noise). The period is 50. It is marked in yellow on the chart.
- Moving average (moving average, determines the current trend by smoothing volatility and noise). The period is 30. It is marked in green on the graph.
- MACD indicator (Moving Average Convergence/Divergence - convergence/divergence of moving averages). A fast EMA period is 12. A slow EMA period is 26. The SMA period is 9.
- Bollinger Bands. The period is 20.
- Non-profit speculative traders are individual traders, hedge funds, and large institutions that use the futures market for speculative purposes and meet certain requirements.
- Long non-commercial positions are the total number of long positions opened by non-commercial traders.
- Short non-commercial positions are the total number of short positions opened by non-commercial traders.
- The total non-commercial net position is a difference in the number of short and long positions opened by non-commercial traders.


