


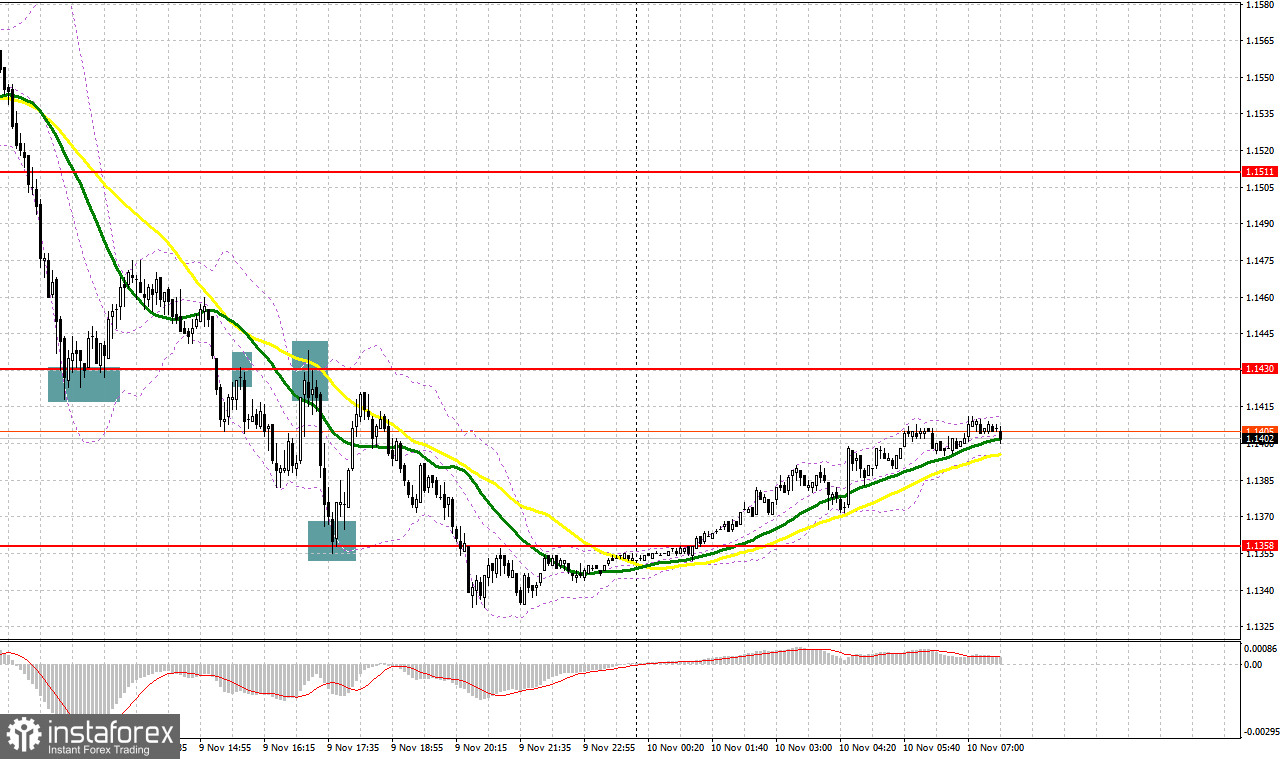
Yesterday, the pair formed several good entry signals. Let's analyze the situation on the 5-minute chart. In my morning review, I mentioned the level of 1.1430 and recommended entering the market from there. It wasn't long until bears pushed the pound down to the area of 1.1430. A false breakout at this level created a good entry point for going long and generated an upside rebound of more than 40 pips. In the afternoon, bears managed to initiate a breakout. As a result, the pair retested 1.1430, creating a nice sell signal. The pound fell by more than 60 pips and retested the level of 1.1358. A false breakout of this support area served as a signal and allowed the pair to recover by 50 pips.
For long positions on GBP/USD:
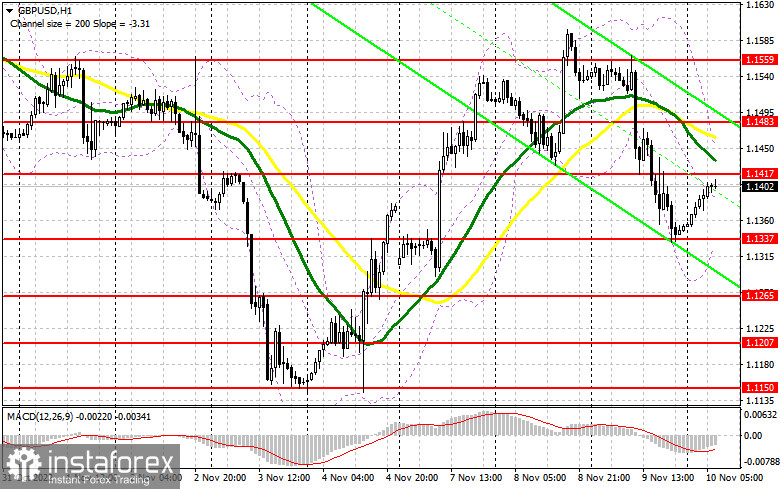
The pressure on the pound is back as more officials of the Bank of England blame the current problems in the economy on the regulator's policy during the pandemic. They say that the central bank should have acted more cautiously. Technically, the UK economy has already slipped into a recession which makes it more difficult for the BoE to raise rates further. At the same time, inflation is far from slowing down which presents the regulator with a difficult choice. Against this backdrop, it is hardly surprising that the pound has failed to develop a steady uptrend. No important data is expected in the UK today except for the speech by Sir David Ramsden, Deputy Governor for Markets and Banking at the BoE, and Silvana Tenreyro, member of the BoE's Monetary Policy Committee. The best moment to open long positions will be a decline in the pound and a false breakout at the nearest support of 1.1337 formed yesterday. The formation of a false breakout at this level will generate a buy signal, considering the recovery of the pair and the retest of the resistance at 1.1417. The moving averages that limit the upside potential of the pair are located above this resistance area. A breakout and a downside test of this range may change the situation in favor of the bulls as they will be able to develop a strong correction towards 1.1483. The level of 1.1559 will act as the most distant target where I recommend profit taking. If bulls fail to protect the level of 1.1337 in the first half of the day, which is very unlikely, the pair will come under more pressure as this will prove the absence of serious buyers in the market. If so, buying is possible only after a false breakout at 1.1265. You can open long positions on GBP/USD right after a rebound from 1.1207 or 1.1150, keeping in mind a possible intraday correction of 30-35 pips.
For short positions on GBP/USD:
Bears have made it clear that they are not going to retreat and their further action will depend on the CPI report in the US that we will discuss in my afternoon review. The main task for bears is to maintain control over the resistance level of 1.1417, above which the moving averages are located. In case the pound rises on hawkish statements from the BoE, only a false breakout of 1.1417 will serve as a good signal for going short. This will allow the sellers to push the pair back to yesterday's low at 1.1337. Its breakout and an upside retest will create a good entry point for selling the pair, considering a possible return to 1.1265. The level of 1.1207 will act as the lowest target where I recommend profit taking. A test of this level will fully cancel the bullish scenario for the pound. If GBP/USD rises and bears are idle at 1.1417, bulls will return to the market, hoping to see weak inflation data and develop a further uptrend. If so, GBP/USD may recover to 1.1483. Only a false breakout at this level will generate a good entry point for selling the pair. If nothing happens there as well, I would recommend selling GBP/USD right at the level of 1.1559, keeping in mind a possible downside pullback of 30-35 pips within the day.
COT report
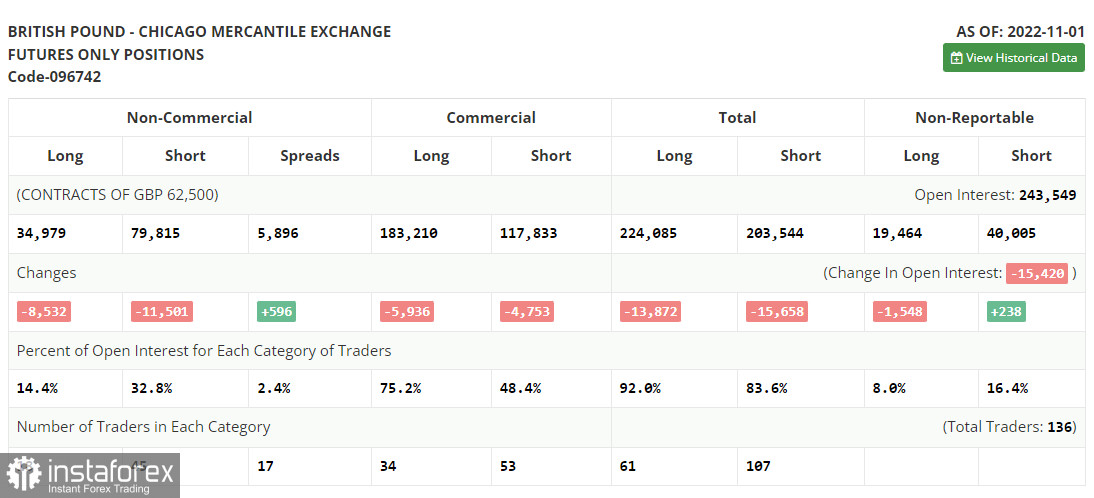
The Commitment of Traders report for November 1 showed a drop in both short and long positions. The reason for this could be the meetings of the US Federal Reserve and the Bank of England that allowed the US dollar to get back its shine among investors for a short term. Apparently, the current COT report does not reflect the results of these meetings. The BoE's decision to raise interest rates came in line with analysts' expectations. Moreover, BoE Governor Andrew Bailey said he was ready to slow down aggressive monetary tightening to support the economy which has been contracting at a rapid pace. He also expressed his concern over the cost-of-living crisis in the UK that may soon be aggravated by the crisis in the real estate market. As the Fed seems to maintain its previous stance on monetary policy while the BoE is getting more dovish, the pound faced a strong sell-off. However, the situation changed when the data on the US labor market revealed its sharp contraction. This could be a signal for the Fed to act more cautiously in the future. According to the latest COT report, the long positions of the non-commercial group of traders fell by 8,532 to 34,979 while short positions declined by 11,501 to 79, 815. This led to a decline in the non-commercial net position to -44,836 from -47 805 a week earlier. The weekly closing price went up to 1.1499 from 1.1489.
Indicator signals:
Moving Averages
Trading below the 30- and 50-day moving averages indicates that the market is changing direction.
Please note that the time period and levels of the moving averages are analyzed only for the H1 chart, which differs from the general definition of the classic daily moving averages on the D1 chart.
Bollinger Bands
In case of a downward movement, the lower band of the indicator at 1.1330. will serve as support.
Description of indicators:
• A moving average of a 50-day period determines the current trend by smoothing volatility and noise; marked in yellow on the chart;
• A moving average of a 30-day period determines the current trend by smoothing volatility and noise; marked in green on the chart;
• MACD Indicator (Moving Average Convergence/Divergence) Fast EMA with a 12-day period; Slow EMA with a 26-day period. SMA with a 9-day period;
• Bollinger Bands: 20-day period;
• Non-commercial traders are speculators such as individual traders, hedge funds, and large institutions who use the futures market for speculative purposes and meet certain requirements;
• Long non-commercial positions represent the total number of long positions opened by non-commercial traders;
• Short non-commercial positions represent the total number of short positions opened by non-commercial traders;
• The non-commercial net position is the difference between short and long positions of non-commercial traders.


