Long-term perspective.

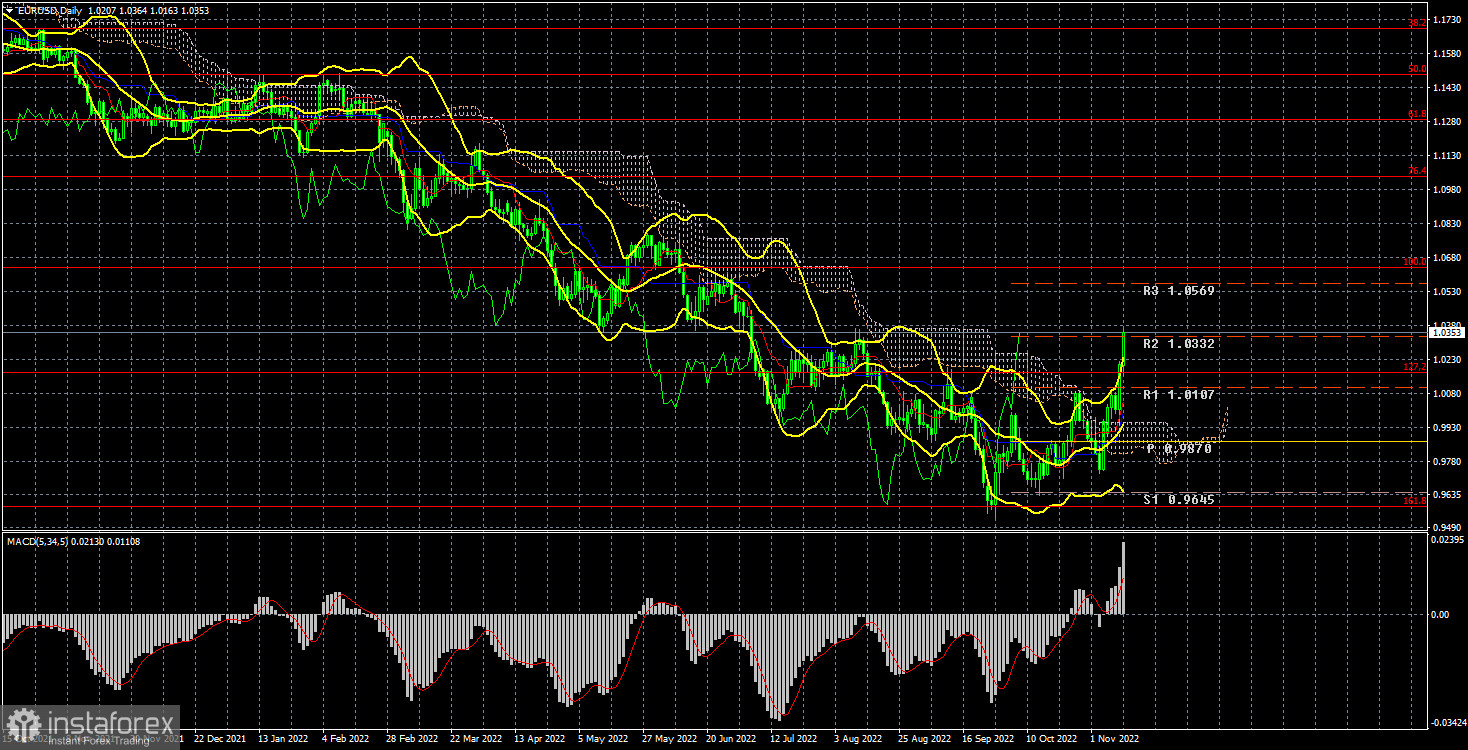
The EUR/USD currency pair has grown by 450 points during the current week, and this can be considered a record of the last two years, during which a strong downward trend has been maintained. Although the fundamental and geopolitical backgrounds have practically not changed, and there was an extremely small amount of news and publications during the current week, now we can say that the pair is on the verge of forming a new upward trend, which may last months or even years. It should be noted that there were a few reasons for the growth this week. The only really important event was the publication of a report on American inflation. There was nothing else interesting or important for the euro or the dollar. Of course, we can also recall the US congressional elections, but there has yet to be a final result. Thus, no conclusions can be drawn.
A couple of days ago, we said that Republicans would most likely win the lower house of Congress, but we stipulated that different sources provide different data. As of Saturday morning, the official information from The Associated Press is as follows. In the House of Representatives, 211 seats will be occupied by Republicans, 199 seats will go to Democrats, and another 25 seats remain undetermined. A majority requires at least 218 seats, so neither the Democrats nor the Republicans have won or lost anything. The situation in Congress is even more interesting. Currently, 47 seats go to Democrats and 48 to Republicans, and three more remain undetermined. Moreover, even preliminary vote counts do not allow us to conclude who will control the Upper House. In Nevada, 95% of the votes were counted, and Adam Laxalt leads with an advantage of 0.1%. A Republican candidate is also leading in Alaska, and the second round of elections will be held in Georgia. That is, the Republicans have not yet won either in Congress or in the House of Representatives. And even if they win, the damage will be minimal. Therefore, it is unlikely that the dollar fell this week to a record value due to inconclusive election results.
COT analysis.
COT reports on the euro currency in 2022 are becoming more and more interesting. Half of the year, they showed a frank "bullish" mood of professional players, but at the same time, the European currency was steadily falling. Then they showed a "bearish" mood for several months, and the euro's value also steadily fell. The net position of non-profit traders is bullish again and is strengthening, and the euro has barely moved away from its 20-year lows by 500 points. This is happening, as we have already said, because the demand for the US dollar remains very high against the backdrop of a difficult geopolitical situation. Therefore, even if the demand for the euro currency grows, the high demand for the dollar does not allow it to grow. During the reporting week, the number of buy contracts from the non-commercial group increased by 13 thousand, and the number of short positions decreased by 17 thousand. Accordingly, the net position increased by about 30 thousand contracts. However, this fact does not matter much since the euro remains "at the bottom" anyway. The second indicator in the illustration above shows that the net position is now quite high. Still, a little higher, there is a chart of the pair's movement, and we can see that the euro cannot benefit from this seemingly bullish factor. The number of buy contracts is higher than that of sell contracts for non-commercial traders by 106 thousand, but the euro is still trading very low. Thus, the net position of the "non-commercial" group can continue to grow, and it does not change anything. If you look at the general indicators of open longs and shorts for all categories of traders, then sales are 23 thousand more (617k vs. 594k).
Analysis of fundamental events.
As we have already said, this week's key event was the inflation report. It showed that prices slowed sharply in October to 7.7% y/y. We cannot conclude that this came as a surprise, but it seems to have come to the market. Although the Fed has raised the rate by 0.75% four times, what else should we expect? We also need to understand the market's reaction to this report in the form of massive dollar sales. It would be logical if it fell by 100 points, but this is a serious drop. The Fed will continue its plans to bring the rate to 4.75–5.00%, so the inflation reports for the US and the dollar are no longer as important as before. Nevertheless, the support of the dollar is falling as the probability of more and more tightening decreases.
Trading plan for the week of November 14-18:
1) During the 24-hour timeframe, the pair overcame the Senkou Span B line, so it has a real chance of long-term growth for the first time in a long time. Of course, these changes could be reversed if geopolitics deteriorate. Still, we can expect an upward movement with a target of 1.0636 (100.0% Fibonacci) and buy the pair.
2) As for the sales of the euro/dollar pair, they have now become temporarily irrelevant since the price has overcome the critical line and Senkou Span B. Now, to be able to consider short positions, you should wait for the price to go back below the key lines of the Ichimoku indicator.
Explanations of the illustrations:
Price levels of support and resistance (resistance and support), Fibonacci levels – targets when opening purchases or sales. Take Profit levels can be placed near them.
Ichimoku indicators (standard settings), Bollinger Bands (standard settings), MACD (5, 34, 5).
Indicator 1 on the COT charts is the net position size of each category of traders.
Indicator 2 on the COT charts is the net position size for the "Non-commercial" group.


