


Analysis of Friday's deals:
30M chart of the GBP/USD pair
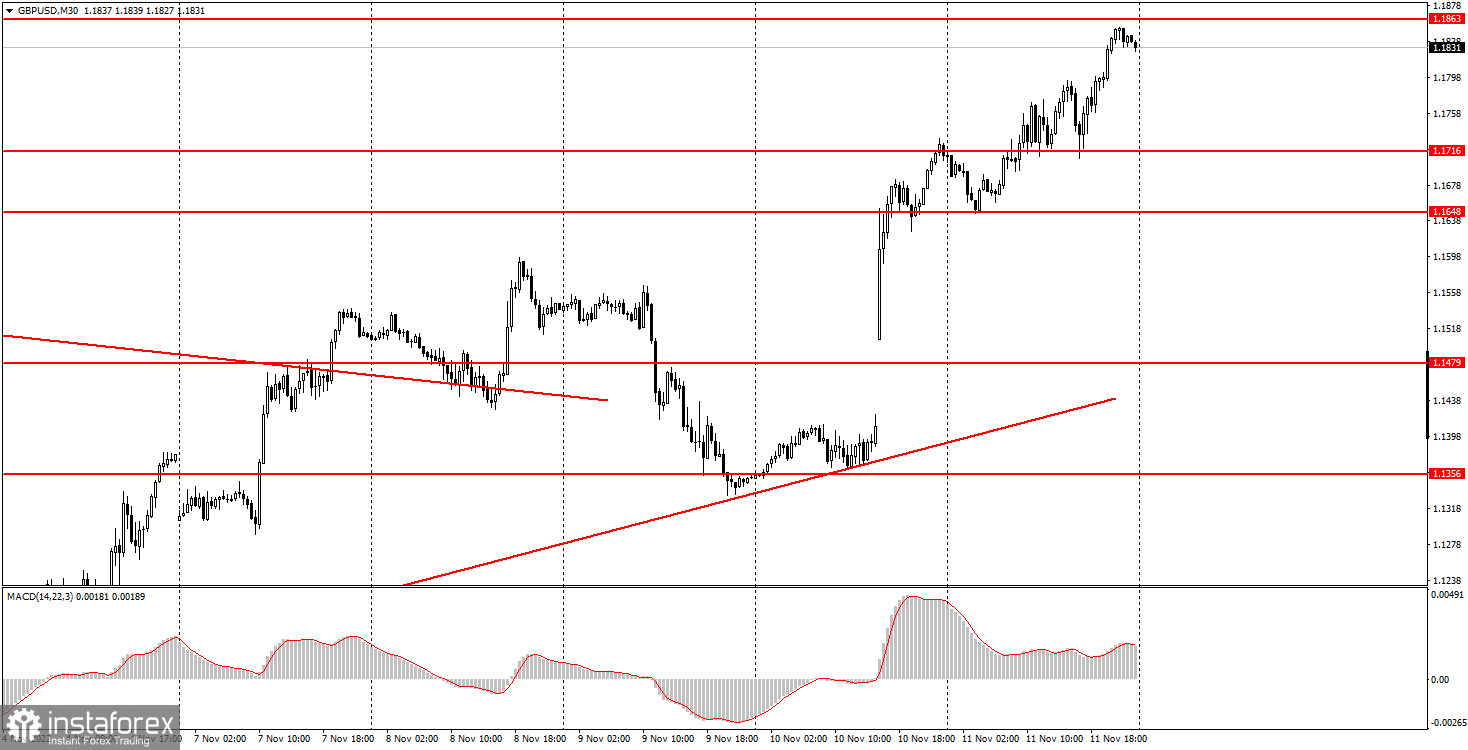
The GBP/USD pair also continued its upward movement on Friday, despite weak data on British GDP and without waiting for US reports. Thus, we can say with confidence that on Friday the market worked "according to its own rules". Most likely, we saw the market reacting to the US inflation report again, because there is no other way to explain the dollar's fall. We have already said that falling inflation is good for the US economy, and traders had reason to sell the dollar after this report. This is because now the Federal Reserve can ease its monetary pressure. However, the dollar fell 400 points against the pound due to one report that, in fact, does not answer the question, when will inflation return to the target level? We believe that if the reaction was logical, then in any case it was excessively strong. However, we also have an upward trend line on the 30-minute timeframe, so all our "fears and expectations" are irrelevant. The market clearly shows us that it is now busy buying, so we should move in the same direction.
5M chart of the GBP/USD pair
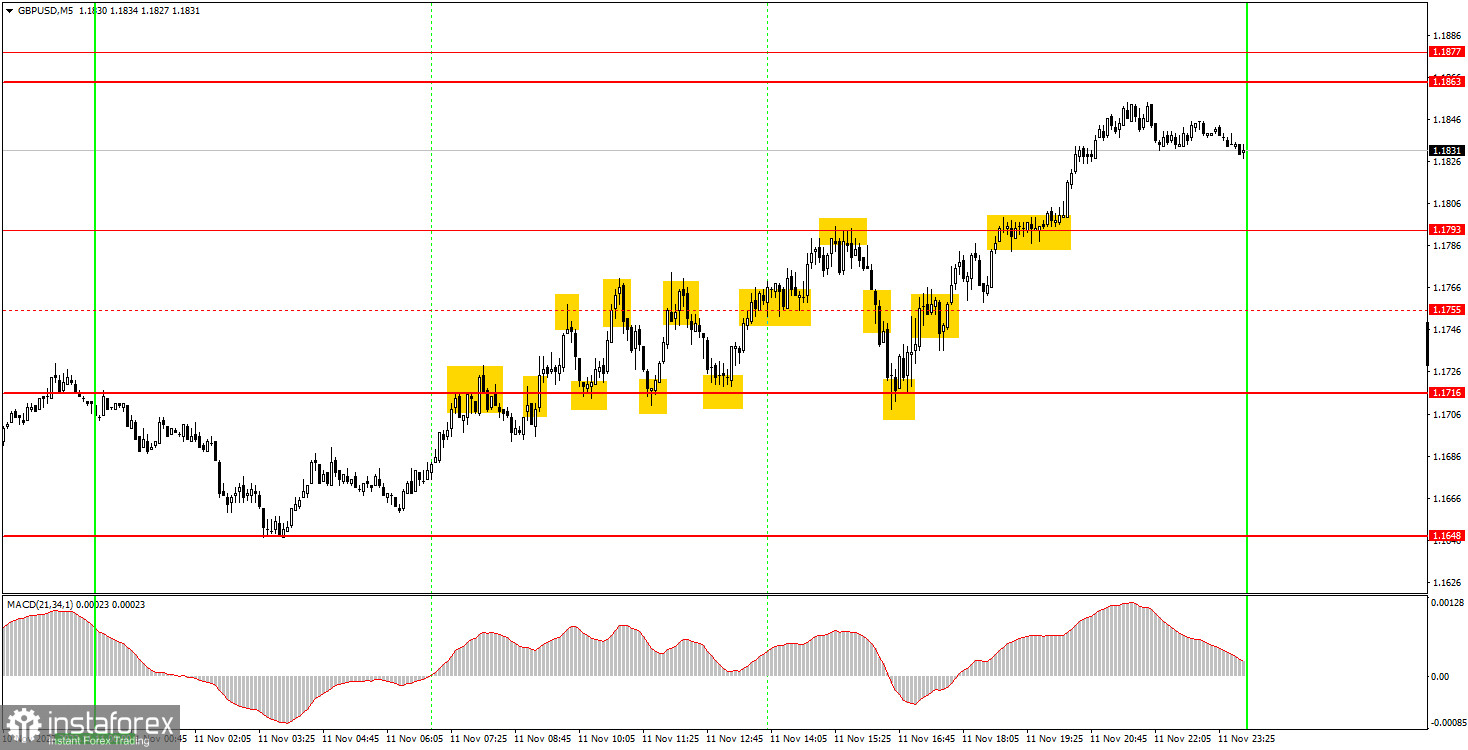
There were a lot of trading signals on the 5-minute timeframe on Friday. Since the volatility was again high, and the pair had many levels on the way, we also received a lot of signals. Many turned out to be false and at the end of the day we removed the level of 1.1755 from the charts. The first sell signal near the level of 1.1716 turned out to be false. Even Stop Loss did not work on it, so the short position was closed at a loss of about 20 points. This was followed by a series of signals from the levels of 1.1716 and 1.1755. Even though the buy signals around 1.1755 turned out to be false, there were other buy signals before they formed, so there was no loss. On the contrary, newcomers could earn 85 points using the "pipsing" method. The last buy signal in the European trading session led to an increase to 1.1793, as well as a profit of 40 points. There was a bounce from 1.1793 and a fall back to 1.1716 for another 40 pips of profit. And we saw another bounce from the level of 1.1716, followed by growth to 1.1793 and overcoming this level. At least another 60 points of profit. Thus, the day turned out to be difficult (there were a lot of signals), but it was possible to get at least 200 points of profit.
How to trade on Monday:
The pound/dollar pair continues its upward movement on the 30-minute TF, which is now supported by an ascending trend line. Although we still don't see a good reason to show such a strong growth, the market can move regardless of our opinion. Therefore, at this time we definitely have an upward trend. On the 5-minute TF tomorrow it is recommended to trade at the levels of 1.1550, 1.1608, 1.1648, 1.1716, 1.1755, 1.1793, 1.1863-1.1877, 1.1967, 1.1994. When the price passes after opening a position in the right direction for 20 points, Stop Loss should be set to breakeven. There are no major events or reports scheduled for Friday in the UK and US, but the pound has been trading very volatile for a couple of months now. We will not be surprised if tomorrow the movements will be strong.
Basic rules of the trading system:
1) The signal strength is calculated by the time it took to form the signal (bounce or overcome the level). The less time it took, the stronger the signal.
2) If two or more positions were opened near a certain level based on false signals (which did not trigger Take Profit or the nearest target level), then all subsequent signals from this level should be ignored.
3) In a flat, any pair can form a lot of false signals or not form them at all. But in any case, at the first signs of a flat, it is better to stop trading.
4) Trade positions are opened in the time period between the beginning of the European session and until the middle of the US one, when all positions must be closed manually.
5) On the 30-minute TF, using signals from the MACD indicator, you can trade only if there is good volatility and a trend, which is confirmed by a trend line or a trend channel.
6) If two levels are located too close to each other (from 5 to 15 points), then they should be considered as an area of support or resistance.
On the chart:
Support and Resistance Levels are the Levels that serve as targets when buying or selling the pair. You can place Take Profit near these levels.
Red lines are the channels or trend lines that display the current trend and show in which direction it is better to trade now.
The MACD indicator (14,22,3) consists of a histogram and a signal line. When they cross, this is a signal to enter the market. It is recommended to use this indicator in combination with trend lines (channels and trend lines).
Important speeches and reports (always contained in the news calendar) can greatly influence the movement of a currency pair. Therefore, during their exit, it is recommended to trade as carefully as possible or exit the market in order to avoid a sharp price reversal against the previous movement.
Beginners on Forex should remember that not every single trade has to be profitable. The development of a clear strategy and money management are the key to success in trading over a long period of time.


