


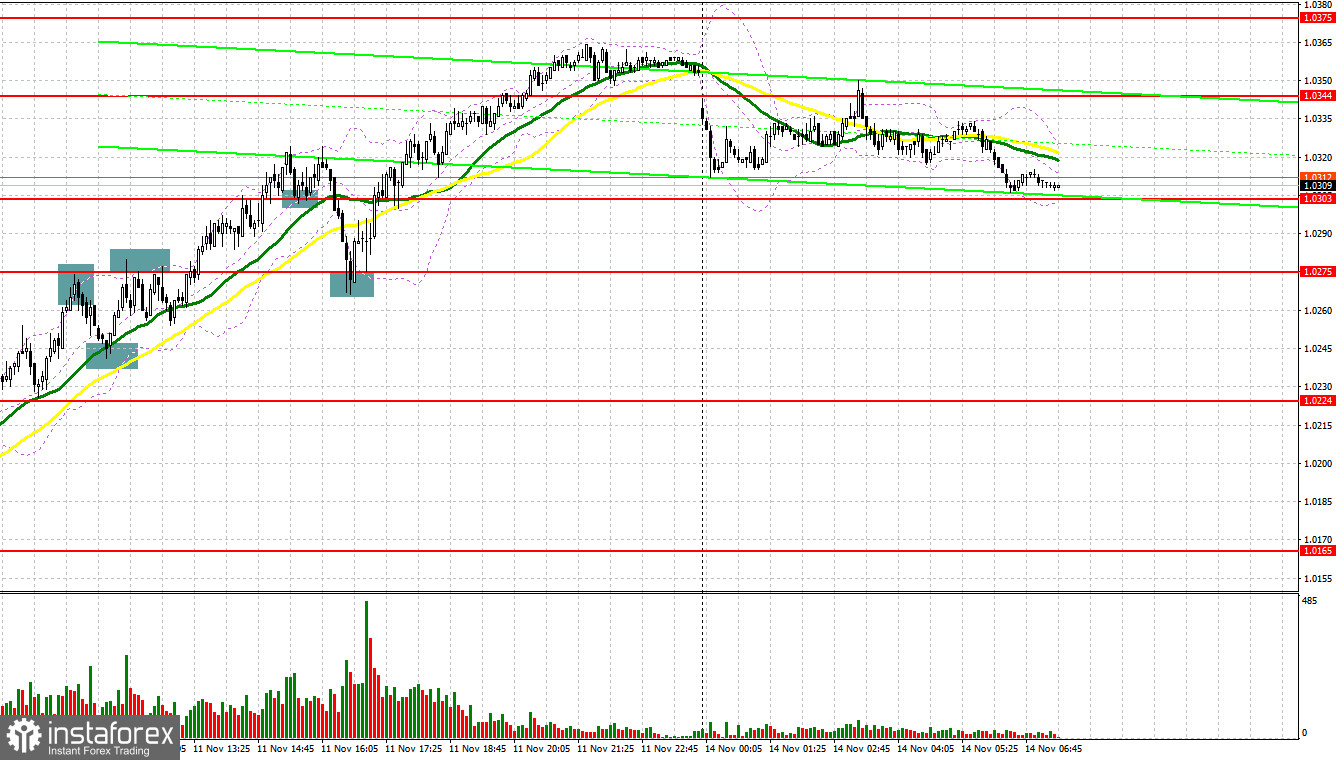
Last Friday, traders received several signals to enter the market. Let us take a look at the five-minute chart to figure out what happened. Earlier, I asked you to pay attention to the level of 1.0243 to decide when to enter the market. The pair reached this level quite rapidly. After that, traders decided to lock in profits. This led to a false breakout and a sell signal. However, the price did not show a considerable correction. Some time later, bulls hit 1.0275, where we also saw a sell signal. This allowed the pair to decline to 1.0243. As a result, traders gained about 30 pips. In the second part of the day, the market sentiment remained bullish. In this light, the pair broke and tested 1.0275, thus giving a buy signal, which allowed the pair to climb by more than 90 pips.
Conditions for opening long positions on EUR/USD
Although the market sentiment is still bullish, to buy the currency traders need at least a minor correction since it is quite risky to open positions, expecting a breakout of highs. The midterm elections in the US are finished. The Republican party managed to gain a majority in the House of Representatives, whereas the Democratic party continued controlling the Senate. This fact contributed to the market stability. Today, there is no statistical data that may considerably affect the market situation. That is why traders should rely on the existing trend. It will be better to go long after a decline and a false breakout near the closest support level of 1.0302. This will allow traders to receive a confirmation that big traders are still in the market and are betting on a further rise in the pair. In this case, the price may return to 1.0344. A breakout and downward test of this level will allow the price to hit a new high of 1.0375 and then, 1.0402, an important resistance level. If the price exceeds this level, this will affect bears' stop orders and give an additional buy signal with the target at 1.0433. In this case, the bullish trend will become stronger by the end of the week. If the euro/dollar pair declines and buyers fail to protect 1.0302, nothing special will happen, but pressure on the euro will increase. In this light, it may slide to the next support level of 1.0268. There, traders may also open long positions after a false breakout. It is also possible to go long just after a bounce of 1.0227 or lower – from 1.0180, expecting an upward correction of 30-35 pips.
Conditions for opening short positions on EUR/USD
Bears are exerting some pressure on the euro amid the news that the Republican party failed to gain full control in the US Congress. What is more, the pair needs a correction to continue its uptrend. Traders should rely on the trend since the eurozone industrial production data for September and speeches that will be provided by ECB's Panetta and Enria will hardly affect the market. Bears will have a chance to push the price lower only after a false breakout near the closest resistance level of 1.0344. This will give traders a perfect entry point and allow them to decline to the support level of 1.0302. A settlement below this area will become possible only in case of dovish comments from the ECB's representatives. An upward test of 1.0302 will give another sell signal with the target at 1.0268. The farthest target is located at 1.0227, where it is recommended to lock in profits. If the euro/dollar pair climbs during the European session and bears fail to protect 1.0344, which is highly likely, demand for the pair will mount, thus boosting the price above 1.0375. In the event of this, sellers should remain cautious. It is possible to go short after a false breakout of the mentioned level. Traders may also open sell orders just after a rebound from the high of 1.0402 or even higher – from 1.0433, expecting a decline of 30-35 pips.
COT report
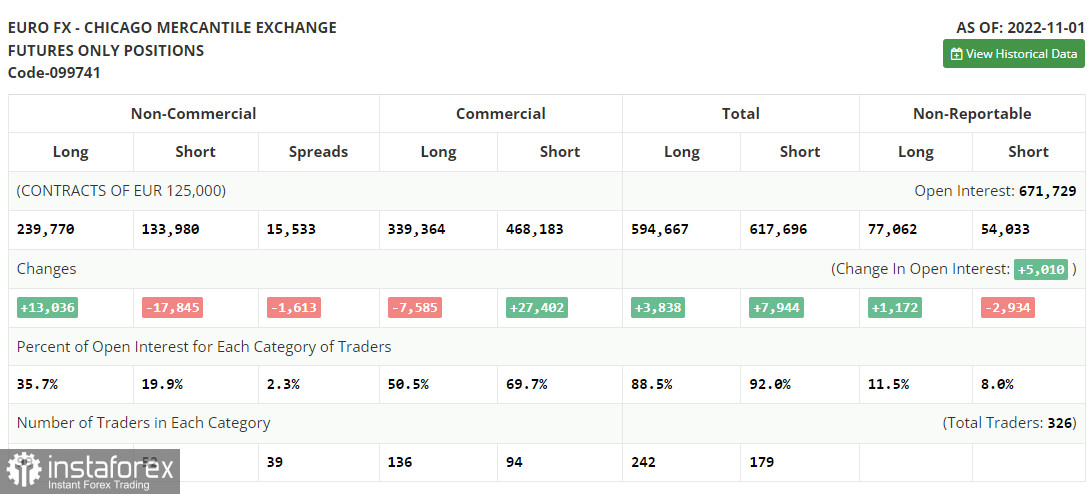
According to the COT report from November 1, the number of both short and long positions dropped. The US dollar continues losing value against risk assets despite the fact that the US Fed remains stuck to its approach. Most traders suppose that the regulator will end its aggressive tightening as early as next spring. After that, it is likely to start cutting the key interest rate quite smoothly. This may considerably boost demand for the euro. This week, such a rise could be triggered by the US inflation report, which has been shaping the Fed's approach. If inflation declines, the US dollar will lose value and the euro will confidently consolidate above the parity level. However, the bullish potential of the euro is also limited. The fact is that the ECB may revise its aggressive monetary policy after a sharp rise in the key interest rate. However, this will happen if the eurozone economy continues contracting. The COT report unveiled that the number of long non-commercial positions increased by 13,036 to 239,770, while the number of short positions dropped by 17,845 to 133,980. At the end of the week, the total non-commercial net position remained positive at 105,790 against 74,909. This indicates that investors continue benefiting from the situation and buying the cheap euro below parity, as well as accumulating long positions, expecting the end of the crisis. The weekly closing price rose to 0.9918 from 1.0000.
Signals of indicators:
Moving Averages
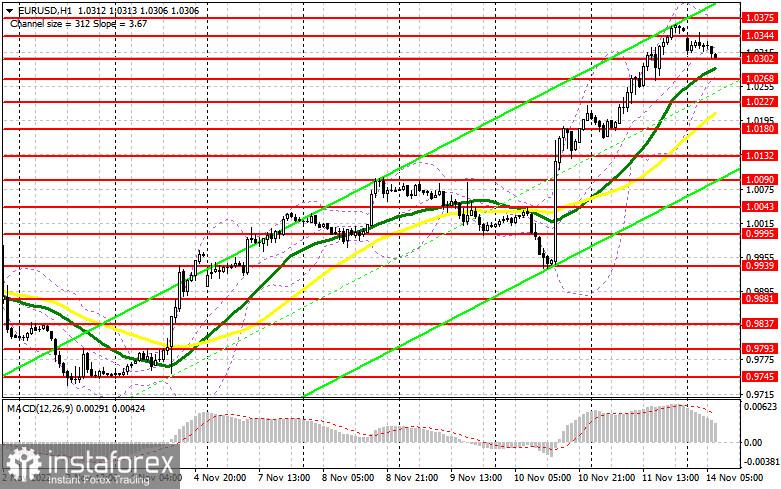
Trading is performed above 30- and 50-day moving averages, which points to a bullish market.
Note: The period and prices of moving averages are considered by the author on the one-hour chart which differs from the general definition of the classic daily moving averages on the daily chart.
Bollinger Bands
In case of a rise, the upper limit of the indicator located at 1.0375 will act as resistance. If the pair drops, support will be the situation at the lower limit of the indicator – at 1.0280.
Description of indicators
- Moving average (moving average, determines the current trend by smoothing volatility and noise). The period is 50. It is marked in yellow on the chart.
- Moving average (moving average, determines the current trend by smoothing volatility and noise). The period is 30. It is marked in green on the graph.
- MACD indicator (Moving Average Convergence/Divergence - convergence/divergence of moving averages). A fast EMA period is 12. A slow EMA period is 26. The SMA period is 9.
- Bollinger Bands. The period is 20.
- Non-profit speculative traders are individual traders, hedge funds, and large institutions that use the futures market for speculative purposes and meet certain requirements.
- Long non-commercial positions are the total number of long positions opened by non-commercial traders.
- Short non-commercial positions are the total number of short positions opened by non-commercial traders.
- The total non-commercial net position is a difference in the number of short and long positions opened by non-commercial traders.


