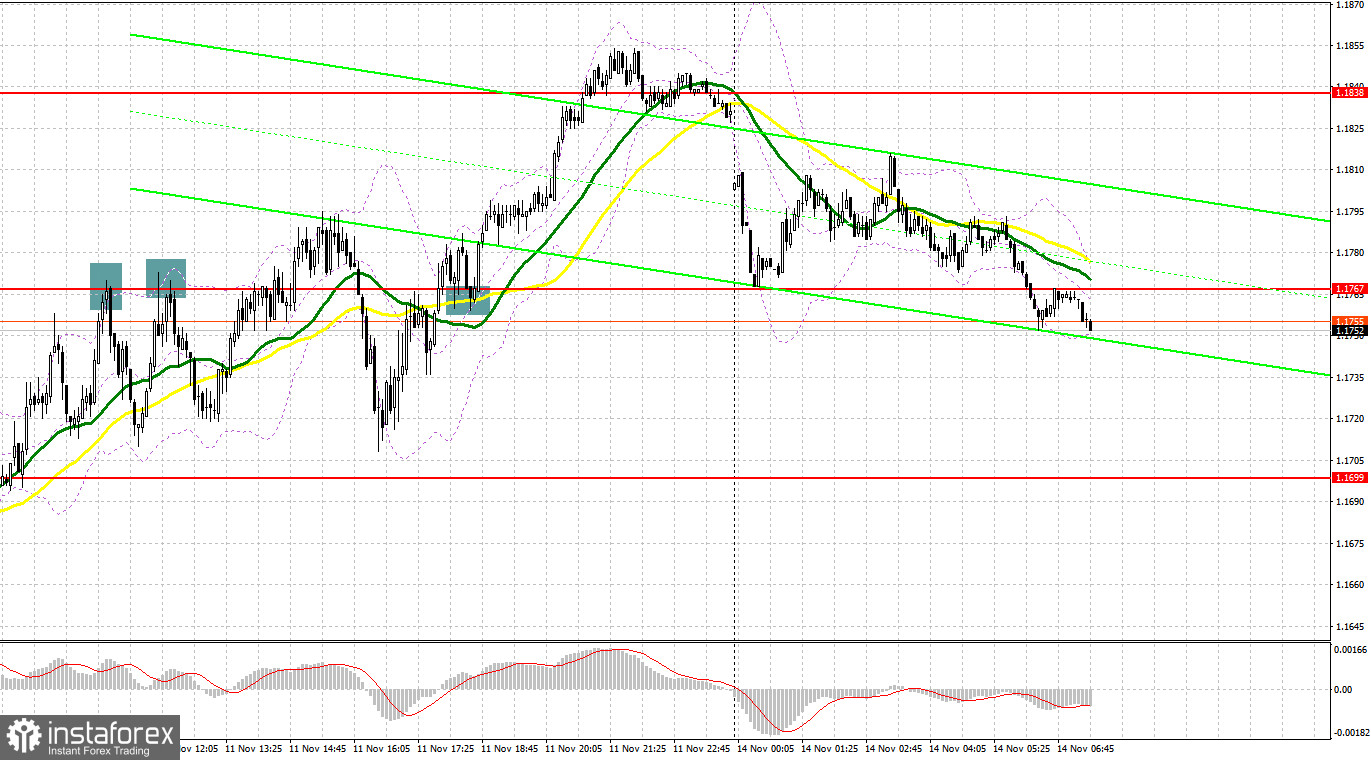
On Friday, there were lots of entry points. Now, let's look at the 5-minute chart and figure out what actually happened. In the morning article, I turned your attention to 1.1722 and 1.1757 and recommended making decisions with these levels in focus. The unsuccessful first attempt to rise above 1.1722 gave a sell signal. The pound sterling declined by 30 pips. However, it climbed again following the release of UK GDP data which was almost in line with analysts' expectations. The pair consolidated above 1.1722. There was also a buy signal. The upward movement totaled more than 30 pips. After that, bears began to actively sell off the pair at 1.1757. Thus, two false breakouts occurred. The pair decreased by about 30 pips. However, it failed to settle below 1.1722. In the afternoon, after another false breakout of 1.1767, there was a sell signal with the pound sterling moving down by 47 pips. Only by the middle of the American session, the bulls managed to push the instrument above 1.1767. A downward test led to a buy signal, which resulted in an increase of more than 80 pips.

When to open long positions on GBP/USD:
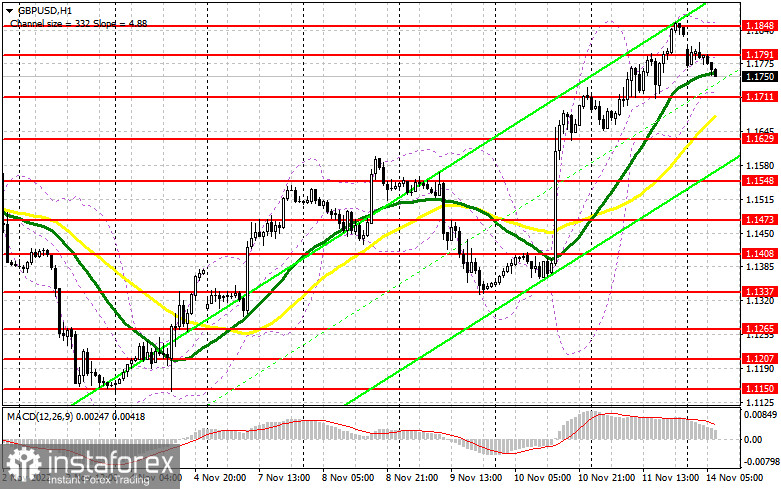
It is quite difficult for bulls to assert strength when the economy is gradually sliding into a recession. The GDP report published on Friday has only confirmed this. For this reason, the Bank of England is unlikely to stick to an ultra-aggressive monetary policy, which is another solid why the pound sterling could soon lose momentum. Today, the economic calendar for the UK is empty. So, there is a high chance of a downward correction after the bull market in the second half of last week. The best option for opening long positions in the current conditions will be a decline to the nearest support level of 1.1711, formed last Friday. Only a false breakout of this level will give a buy signal. The pair may return and test the resistance level of 1.1791, which limits further growth. A breakout and a downward test of this level may help bulls regain control. A rise above 1.1791 could trigger a stronger uptrend with the prospect of a jump to 1.1848. A more distant target will be the 1.1899 level where I recommend locking in profits. If the bulls fail to push the pound sterling to 1.1711, which may happen in the first half of the day, the pressure on the pair will increase significantly. Traders will rush to close long positions. In this case, it is better to open long positions only if a false breakout of 1.1629 takes place. You can buy GBP/USD immediately at a bounce from 1.1548 or 1.1473, keeping in mind an upward intraday correction of 30-35 pips.
When to open short positions on GBP/USD:
Sellers have returned to the market after the end of the US midterm election. They want to regain control of the market. Today, bears need to push the pair to the resistance level of 1.1791. If they manage to hold the price below this level, it will significantly undermine the bullish trend. If they fail, bulls will definitely regain the upper hand. A false breakout of 1.1791 will generate a sell signal. GBP/USD may depreciate to 1.1711 where the moving averages are passing in positive territory. A breakout and an upward test of this level will give a new sell signal. The pair could tumble to 1.1629, which will deliver a severe blow to the bullish trend. A more distant target will be the 1.1548 level where I recommend locking in profits. A test of this level will put an end to the bull run. If GBP/USD climbs and bears show no energy at 1.1791, the bulls will return to the market. GBP/USD may recover to 1.1848. Only a false breakout of this level will give a sell signal, indicating further downward movement. If bears show no activity there, you can sell GBP/USD immediately at a bounce from 1.1899, keeping in mind a downward intraday correction of 30-35 pips.

COT report
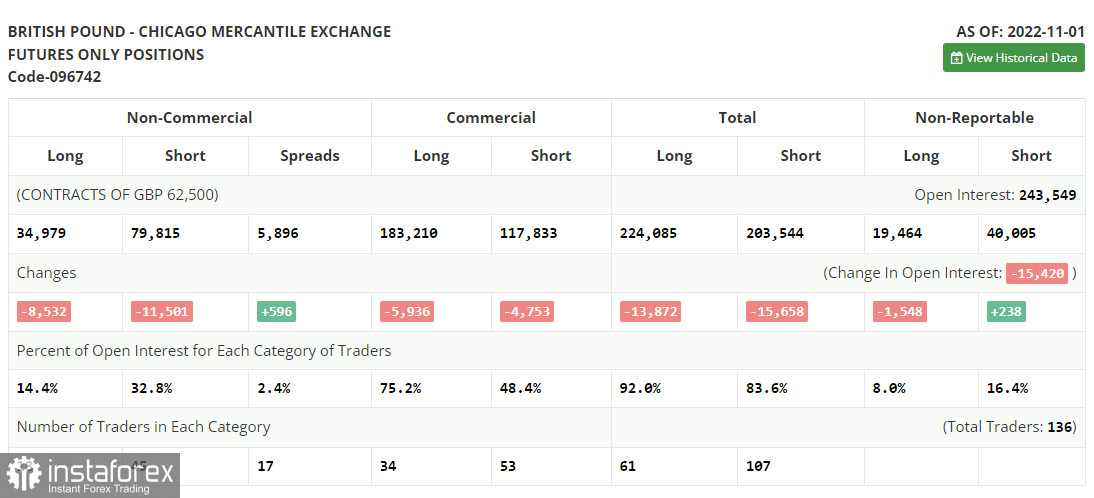
The report (Commitment of Traders) for November 1 logged a drop in both short and long positions. The pound sterling dipped ahead of the Fed and BoE meetings as the US dollar, on the contrary, won luster with investors. However, it did not last long. The current COT report does not take into the results of those meetings. The Bank of England announced another rate hike, which was in line with economists' forecasts. BoE Governor Andrew Bailey said he was ready to slow down aggressive tightening to avoid further weakening of the economy. Currently, the economy is contracting rapidly. He also expressed concerns about the crisis of the cost of living in the UK. Given the sharp increase in interest rates, the real estate market crisis may also take place in the near future. As a result, there was a major sell-off of the pound sterling as the BoE could switch to a dovish stance. At the same time, the Fed remains strongly committed to a hawkish one. The situation changed dramatically after the release of the Nonfarm Payrolls report, which indicated a sharp decline in the labor market. So, the Fed is likely to act more cautiously in the future when it comes to key rate hikes. The latest COT report revealed that the number of long non-commercial positions decreased by 8,532 to 34,979, while the number of short non-commercial positions declined by 11,501 to 79,815. It led to a slight drop in the negative delta of the non-commercial net position to -44,836 against -47,805 a week earlier. The weekly closing price rose to 1.1499 against 1.1489.

Indicators' signals:
Trading is carried out above the 30 and 50 daily moving averages. It signals a trend reversal.
Moving averages
Note: The period and prices of moving averages are considered by the author on the H1 (1-hour) chart and differ from the general definition of the classic daily moving averages on the daily D1 chart.
Bollinger Bands
If GBP/USD moves down, the indicator's lower border at 1.1711 will serve as support.
Description of indicators
- Moving average (moving average, determines the current trend by smoothing out volatility and noise). Period 50. It is marked yellow on the chart.
- Moving average (moving average, determines the current trend by smoothing out volatility and noise). Period 30. It is marked green on the chart.
- MACD indicator (Moving Average Convergence/Divergence - convergence/divergence of moving averages) Quick EMA period 12. Slow EMA period to 26. SMA period 9
- Bollinger Bands (Bollinger Bands). Period 20
- Non-commercial speculative traders, such as individual traders, hedge funds, and large institutions that use the futures market for speculative purposes and meet certain requirements.
- Long non-commercial positions represent the total long open position of non-commercial traders.
- Short non-commercial positions represent the total short open position of non-commercial traders.
- Total non-commercial net position is the difference between the short and long positions of non-commercial traders.


