


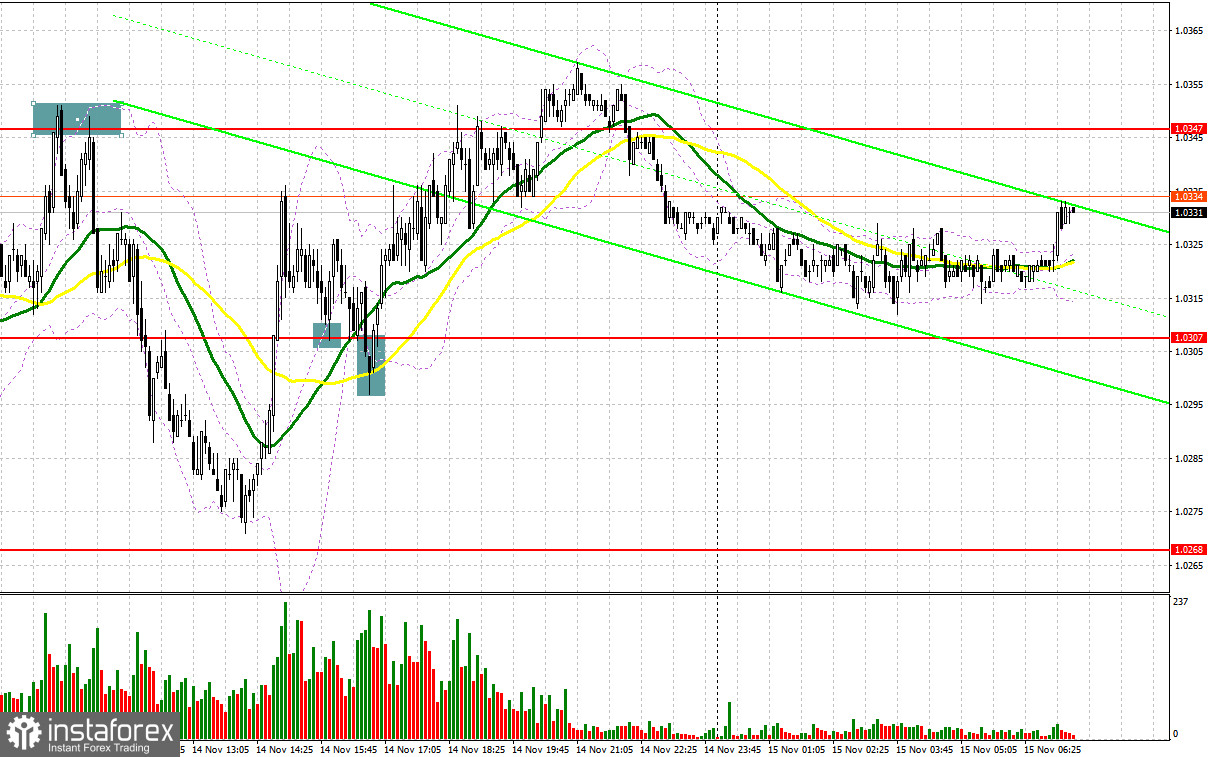
Yesterday, traders received several perfect signals to enter the market. Let us take a look at the 5-minute chart to clear up the market situation. Earlier, I asked you to pay attention to the level of 1.0344 to decide when to enter the market. In the first part of the day, the pair showed a rapid rise to this level. After that, buyers decided to lock in profits. This led to a false breakout and a sell signal, which caused a slump to 1.0268. Thus, sellers earned more than 70 pips. In the second part of the day, bulls managed to regain control over the market, whereas a test of 1.0307 gave a perfect buy signal. As a result, the pair jumped to the resistance level of 1.0347, allowing traders to earn about 40 pips.
Conditions for opening long positions on EUR/USD:
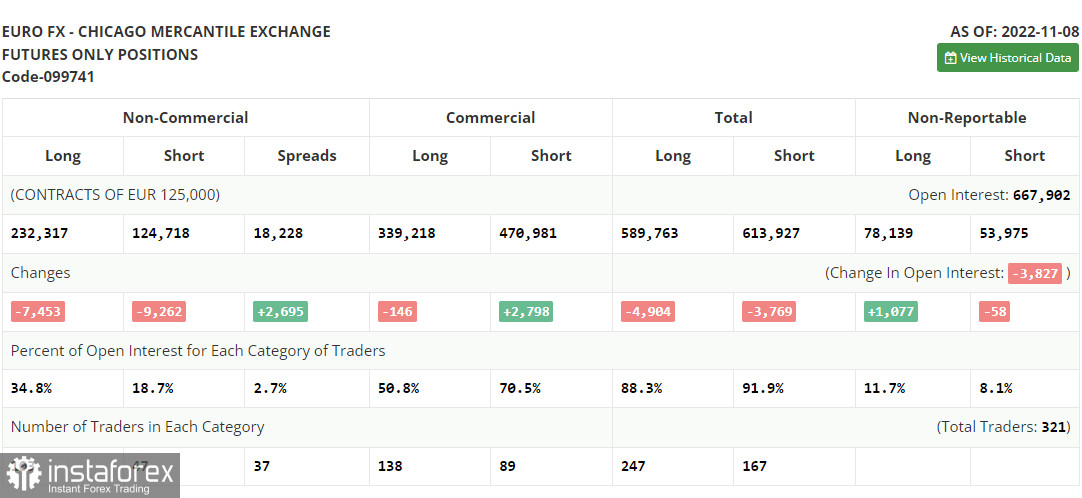
Now, let us primarily focus on the futures market and changes in the COT report. According to the COT report from November 8, the number of both short and long positions dropped. However, we cannot fully rely on the data since it does not reflect the market situation amid the US inflation figures. The fact is that the US Fed will continue to increase the key interest rate despite a slowdown in consumer price growth. In December, the regulator may raise the benchmark rate by 0.5% or 0.75%. Meanwhile, demand for risk assets, including the euro, has increased. The key reason is a lower pace of the key interest rate hike by the Fed and a further rise in the ECB's interest rate. More and more European politicians are considering a more aggressive approach since it is impossible to cope with surging inflation using moderate measures. However, if the eurozone economy continues to contract that fast, the ECB will hardly switch to a more hawkish stance. This, in turn, will cap the pair's upward potential in the mid term. According to the COT report, the number of long non-commercial positions dropped by 7,453 to 232,317, while the number of short non-commercial positions declined by 9,262 to 124,718. At the end of the week, the total non-commercial net position remained positive at 107,599 against 105,790. This indicates that investors continue benefiting from the situation and buying the cheap euro below parity, as well as accumulating long positions, expecting the end of the crisis. The weekly closing price rose to 1.0104 from 0.9918.
This day is expected to be rich in macroeconomic events. If the euro increases amid the data, it is likely to go on rising this week. Germany and the eurozone are planning to disclose the ZEW economic sentiment data. The indicator is expected to increase. However, the eurozone GDP report for the third quarter may unveil a decline, which may lead to a larger sell-off of the euro. To maintain an uptrend, bulls should protect the nearest support level of 1.0314, where there are buyers' MAs. If the pair declines, only a false breakout of the level will give a long signal with the target at new monthly highs. In this case, the price will exceed the new resistance level of 1.0359. A breakout and a downward test of this level amid positive data will allow the pair to climb to a new high of 1.0402. This will provide traders with the hope that the pair may increase to 1.0433. The farthest target is located at 1.0460. If the pair hits this level, the market picture will change considerably. There, traders should lock in profits. If the euro/dollar pair declines and buyers fail to protect 1.0314, the overall situation will start changing. Only a false breakout of the next support level of 1.0275, which is the lower limit of the short-term sideways channel, will be a reason to buy the euro. Traders may go long just after a bounce off the support level of 1.0227 or even lower – from the low of 1.0180, expecting a rise of 30-35 pips.
Conditions for opening short positions on EUR/USD:
Sellers showed noticeable activity, thus proving their presence in the market. Only weak data on the eurozone GDP, which may decline more than expected, will put pressure on the euro again. Today, traders may open sell orders after a false breakout near the closest resistance level of 1.0359. A failure to consolidate at this level will lead to a decline to the middle of the sideways channel at 1.0314. A breakout and settlement below this level as well as an upward test will give an additional sell signal, which will affect buyers' stop orders and cause a drop to 1.0275. There, traders should lock in profits. The pair may go beyond this level only in case of strong data from the US, which is expected in the second part of the day. If the euro/dollar pair increases during the European session and bears fail to protect 1.0359, the pair will show a more considerable increase. In this case, traders should avoid sell orders until the price hits 1.0402. A false breakout of this level will give a new sell signal. It is also possible to go short just after a rebound from the high of 1.0433 or even higher – from 1.0460, expecting a drop of 30-35 pips.
Signals of indicators:
Moving Averages
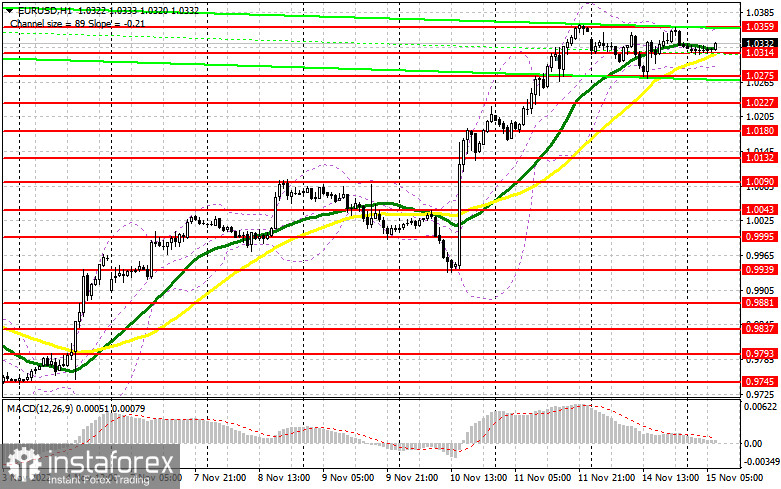
Trading is performed above 30- and 50-day moving averages, which points to a further rise in the euro.
Note: The period and prices of moving averages are considered by the author on the one-hour chart which differs from the general definition of the classic daily moving averages on the daily chart.
Bollinger Bands
If the pair drops, support will be situated at the lower limit of the indicator – at 1.0300. A breakout of the upper limit of the indicator located at 1.0340 will cause an increase in the euro.
Description of indicators
- Moving average (moving average, determines the current trend by smoothing volatility and noise). The period is 50. It is marked in yellow on the chart.
- Moving average (moving average, determines the current trend by smoothing volatility and noise). The period is 30. It is marked in green on the graph.
- MACD indicator (Moving Average Convergence/Divergence - convergence/divergence of moving averages). A fast EMA period is 12. A slow EMA period is 26. The SMA period is 9.
- Bollinger Bands. The period is 20.
- Non-profit speculative traders are individual traders, hedge funds, and large institutions that use the futures market for speculative purposes and meet certain requirements.
- Long non-commercial positions are the total number of long positions opened by non-commercial traders.
- Short non-commercial positions are the total number of short positions opened by non-commercial traders.
- The total non-commercial net position is a difference in the number of short and long positions opened by non-commercial traders.


