


Trend-following analysis (picture 1)
On Tuesday, GBP/USD is expected to trade up from the closing level of yesterday's daily candlestick at 1.1753. The price could try to reach the landmark resistance at 1.1904 plotted by the blue dotted line. When this level is tested, the price might climb higher from this level, aiming to reach 1.2008, the 85.4% retracement plotted by the blue dotted line. From this level, GBP/USD is likely to retrace downwards.
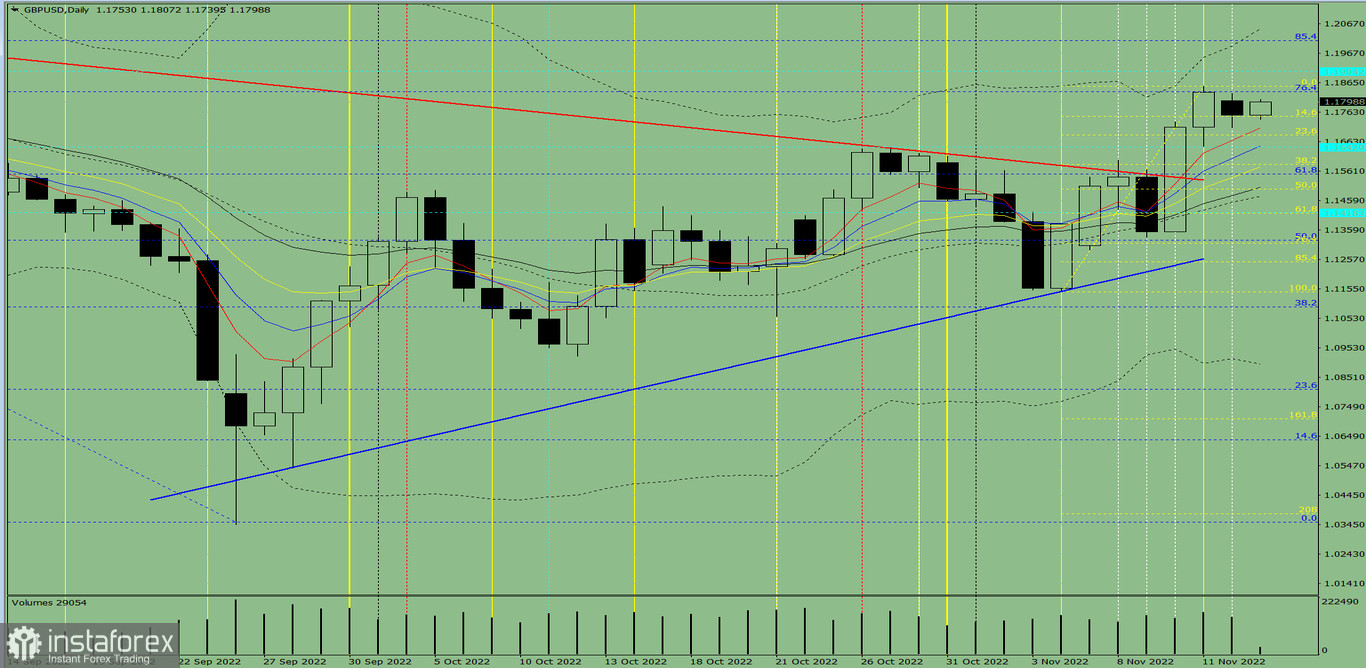
Picture 1 (daily chart)
Complex analysis
Indicator analysis – up
Fibonacci levels – up
Trading volume – up
Candlestick analysis – up
Trend-following analysis – up
Bollinger bands – up
Weekly chart – up
Conclusion
Today, GBP/USD is expected to trade up from the closing level of yesterday's daily candlestick at 1.1753. The price could try to reach the landmark resistance at 1.1904 plotted by the blue dotted line. When this level is tested, the price might climb higher from this level, aiming to reach 1.2008, the 85.4% retracement plotted by the blue dotted line. From this level, GBP/USD is likely to retrace downwards.
Alternative scenario
From the closing level of yesterday's daily candlestick at 1.1753, in the course of its upward move, the price could try to reach the upper fractal at 1.1853 plotted by the yellow dotted line. When this level is tested, GBP/USD could retrace downwards.


