


The pair reached this level quite quickly in the morning. After that, a breakout without a downward test took place. For this reason, there were no entry points for long positions. In the afternoon, the technical outlook was slightly revised.
When to open long positions on EUR/USD:
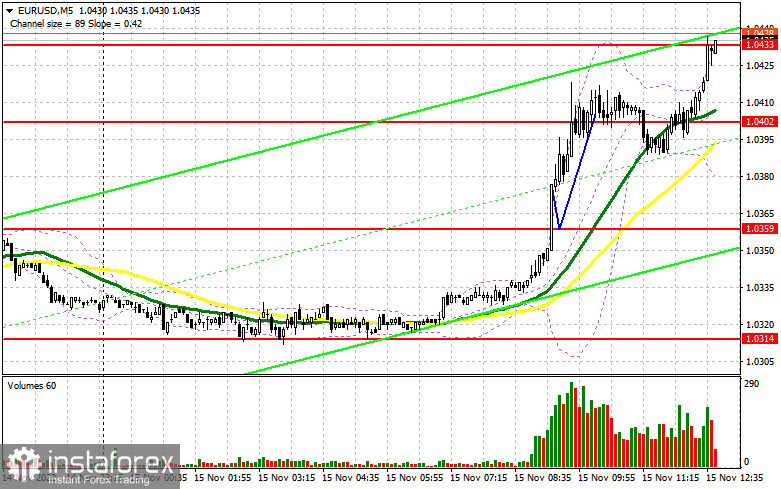
The bulls are now trying to push the pair above 1.0433. if they succeed, the pair is sure to reach new highs. The ZEW Economic Sentiment Index for Germany and the eurozone turned out to be much better than economists' forecasts. It fueled risk appetite and traders increased long positions on the pair amid the bullish trend. In the afternoon, the US Producer Price Index and the NY Empire State Manufacturing Index are due. Even if these indicators grow, bears are unlikely to regain control of the market. This is why traders are betting on a further rise. The speeches of Fed policymakers Lisa Cook and Michael Barr will hardly affect market sentiment as traders will ignore them. It would be appropriate to open long positions on the euro after a downward correction to the nearest support level of 1.0394, formed in the morning. A false breakout of this level will give a buy signal. It will facilitate upward movement and the pair may return to the resistance level of 1.0433. A breakout and a downward test of this level will open the way to 1.0460. If so, bulls will certainly take the upper hand. The pair could approach 1.0493 where I recommend locking in profits. If EUR/USD declines during the US session and bulls show no activity at 1.0394, traders may rush to close long positions. It will lead to a further decrease in the euro. In this case, only a false breakout of the support level of 1.0353 will give a buy signal. The moving averages are passing below this level. You can buy EUR/USD at a bounce from 1.0314 or 1.0275, keeping in mind an upward intraday correction of 30-35 pips.
When to open short positions on EUR/USD:
Sellers failed to push the pair to the target levels. So, they are now in no hurry to return to the market. The pair is still rising and it is difficult to predict which level it may reach. As I have already mentioned above, even amid positive US macro stats, the situation is unlikely to change today. Under the best-case scenario, bears could start a downward correction. Before that, they need to push the price to the resistance level of 1.0433. At the time of writing the article, bulls and bears were tussling for this level. It is recommended to open short positions after a false breakout of this level. Only in this case, a decrease and an upward test of test 1.0394 may occur. If this scenario comes true, there could be an additional sell signal. Bulls will have to close Stop Loss orders. The euro may tumble to 1.0353 where I recommend locking in profits. If EUR/USD rises during the US session and bears show no energy at 1.0433, the bullish trend will persist. The pair is likely to jump to 1.0460. If bears fail to assert strength at this level, it is better to postpone short positions until a false breakout of 1.0493 takes place. You can sell EUR/USD immediately at a bounce from 1.0525, keeping in mind a downward intraday correction of 30-35 pips.
COT report
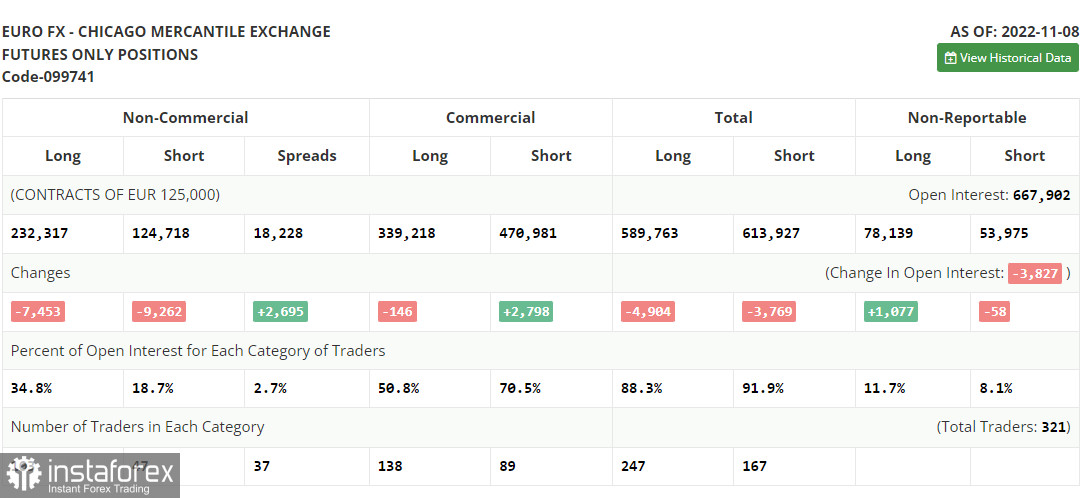
According to the COT report from November 8, the number of both short and long positions dropped. However, we cannot fully rely on the data since it does not reflect the market situation amid the US inflation figures. The fact is that the US Fed will continue to increase the key interest rate despite a slowdown in consumer price growth. In December, the regulator may raise the benchmark rate by 0.5% or 0.75%. Meanwhile, demand for risk assets, including the euro, has increased. The key reason is a slower pace of the key interest rate hike by the Fed and a further rise in the ECB's interest rate. More and more European politicians are considering a more aggressive approach since it is impossible to cope with surging inflation using moderate measures. However, if the eurozone economy continues to contract that fast, the ECB will hardly switch to a more hawkish stance. This, in turn, will cap the pair's upward potential in the midterm. According to the COT report, the number of long non-commercial positions dropped by 7,453 to 232,317, while the number of short non-commercial positions declined by 9,262 to 124,718. At the end of the week, the total non-commercial net position remained positive at 107,599 against 105,790. This indicates that investors continue benefiting from the situation and buying the cheap euro below parity, as well as accumulating long positions, expecting the end of the crisis. The weekly closing price rose to 1.0104 from 0.9918.
Indicators' signals:
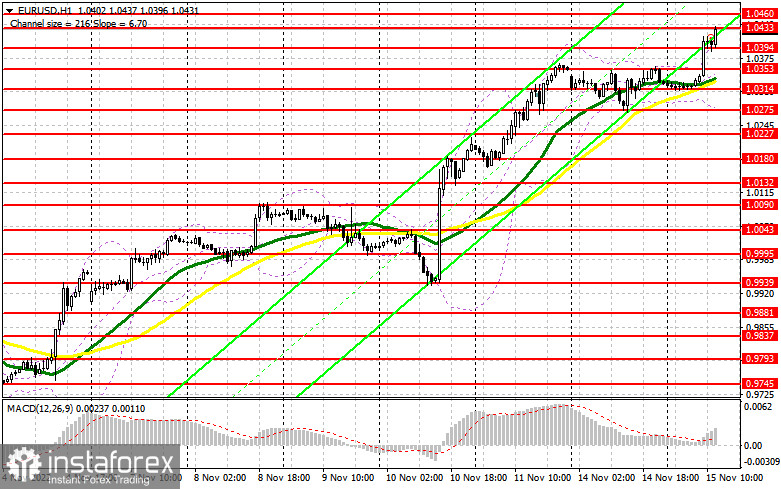
Trading is carried out above the 30 and 50 daily moving averages, signaling a further increase in the euro.
Moving averages
Note: The period and prices of moving averages are considered by the author on the H1 (1-hour) chart and differ from the general definition of the classic daily moving averages on the daily D1 chart.
Bollinger Bands
If EUR/USD moves down, the indicator's lower border at 1.0275 will serve as support.
Description of indicators
- Moving average (moving average, determines the current trend by smoothing out volatility and noise). Period 50. It is marked yellow on the chart.
- Moving average (moving average, determines the current trend by smoothing out volatility and noise). Period 30. It is marked green on the chart.
- MACD indicator (Moving Average Convergence/Divergence - convergence/divergence of moving averages) Quick EMA period 12. Slow EMA period to 26. SMA period 9
- Bollinger Bands (Bollinger Bands). Period 20
- Non-commercial speculative traders, such as individual traders, hedge funds, and large institutions that use the futures market for speculative purposes and meet certain requirements.
- Long non-commercial positions represent the total long open position of non-commercial traders.
- Short non-commercial positions represent the total short open position of non-commercial traders.
- Total non-commercial net position is the difference between the short and long positions of non-commercial traders.


