Details of the economic calendar of November 16
Inflation in the UK reached a 41-year high. The consumer price index rose from 10.1% to 11.1%. Consequently, the Bank of England will continue to raise interest rates at the same pace.
Prime Minister Rishi Sunak said on this occasion that inflation control is a key goal of the government.
As for the US ballot count, the preliminary totals are:
House of Representatives: Democrats 211 - Republicans 218. Control requires 218 seats out of 435.
Senate: Democrats 50 - Republicans 49. Control requires 51 seats out of 100.
Although counting of votes is still ongoing, President Joe Biden officially congratulated the future House speaker Kevin McCarthy on his election victory.
The Republican Party gains control of the US House of Representatives in the midterm elections.
Analysis of trading charts from November 16
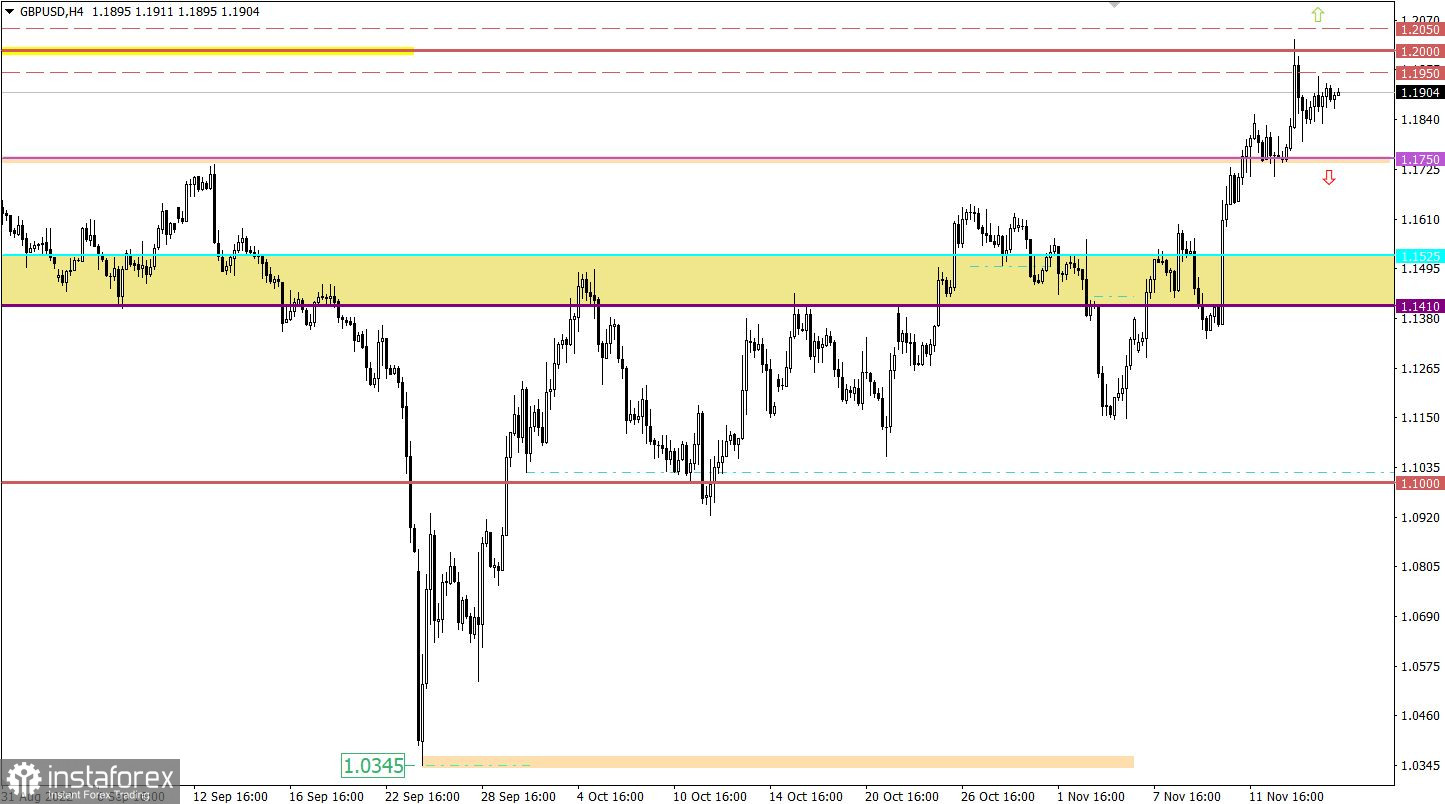
The GBPUSD currency pair is in the stage of a pullback-stagnation relative to the psychological level of 1.2000. The absence of a transition to a full-size correction suggests that traders' interest in long positions on the pound sterling is still maintained in the market.
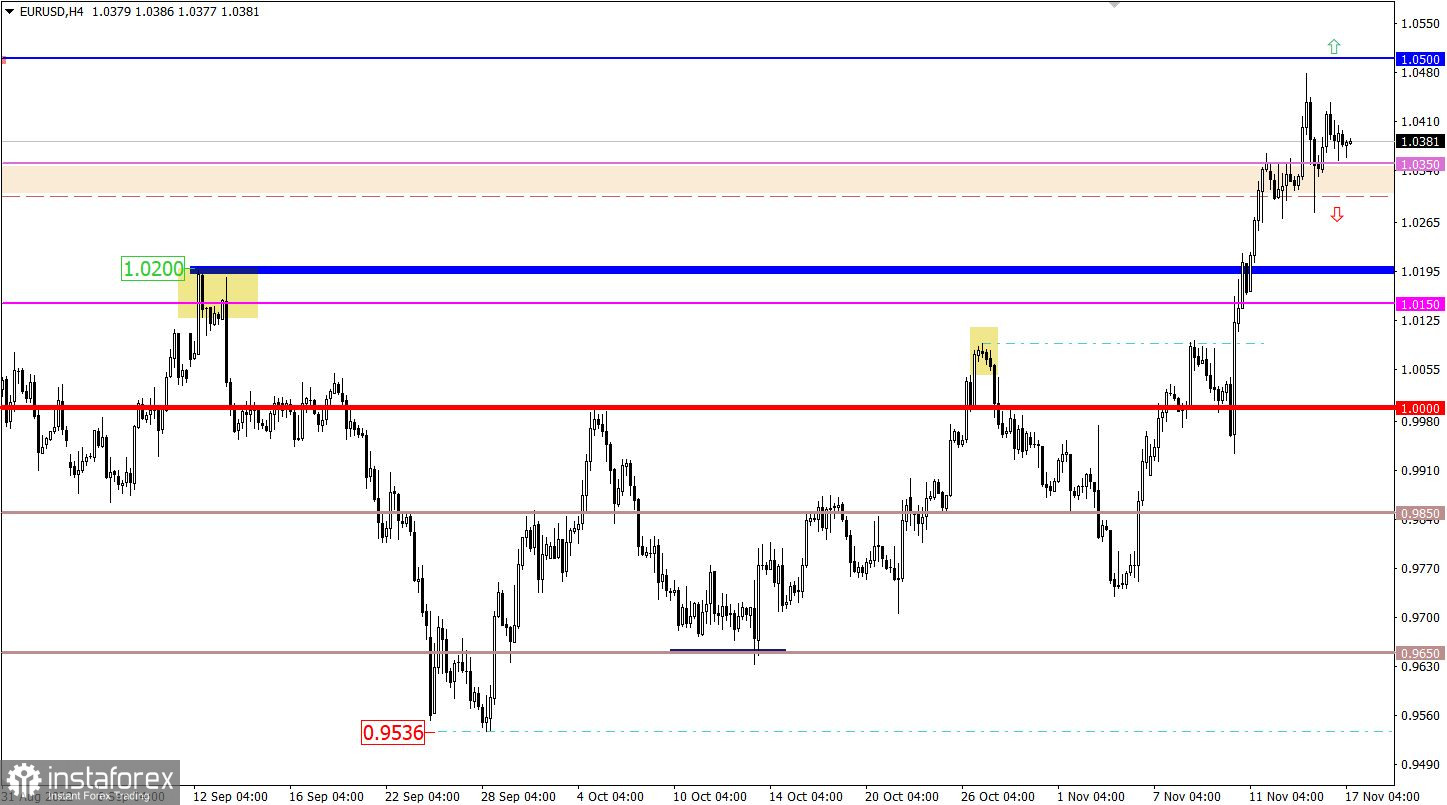
The EURUSD currency pair formed a stagnation at the conditional peak of the ascending cycle. This occurred after the quote came close to the 1.0500 resistance level.

Economic calendar for November 17
Today, the final data on inflation in the European Union is expected, the growth rate of which should accelerate from 9.9% to 10.7%. The market is more ready for these indicators, so if they coincide, you should not expect anything drastic. In any case, rising inflation is a clear signal that the ECB will continue to raise interest rates at the current pace.
During the American trading session, weekly data on jobless claims in the United States will be published, where figures are expected to rise. This is a negative factor for the US labor market.
Statistics details:
The volume of continuing claims for benefits may increase from 1.493 million to 1.5 million.
The volume of initial claims for benefits may remain at the same level of 225,000.
Time targeting:
EU Inflation – 10:00 UTC
US Jobless Claims – 13:30 UTC
Trading plan for EUR/USD on November 17
In this situation, the stagnation of the past day can serve as a catalyst for trading forces, in which there was a regrouping of working positions. In this case, subsequent price jumps are not excluded. The following values are considered as signal levels: 1.2050, in case of an upward scenario, which may lead to the prolongation of the current cycle; 1.1750, while holding below this value, a transition from the pullback stage to the full-size correction stage is possible.

Trading plan for GBP/USD on November 17
Little has changed on the chart compared to the previous day—the quote is standing still. This means that there is a process of accumulation of trading forces before a new speculative price jump.
From a technical analysis point of view, the signal levels are in the values: 1.0500 for an upward scenario and 1.0300 for a downward price development.

What is shown in the trading charts?
A candlestick chart view is graphical rectangles of white and black light, with sticks on top and bottom. When analyzing each candle in detail, you will see its characteristics of a relative period: the opening price, closing price, and maximum and minimum prices.
Horizontal levels are price coordinates, relative to which a stop or a price reversal may occur. These levels are called support and resistance in the market.
Circles and rectangles are highlighted examples where the price of the story unfolded. This color selection indicates horizontal lines that may put pressure on the quote in the future.
The up/down arrows are the reference points of the possible price direction in the future.


