


In the morning article, I turned your attention to 1.0384 and recommended making decisions with this level in focus. Now, let's look at the 5-minute chart and figure out what actually happened. The pair reached this level quickly in the morning. It seemed to have consolidated at this level. However, I decided not to open long positions ahead of inflation data, which is due quite soon. For the afternoon, the technical outlook has not changed. Traders are likely to focus primarily on 1.0384 again.
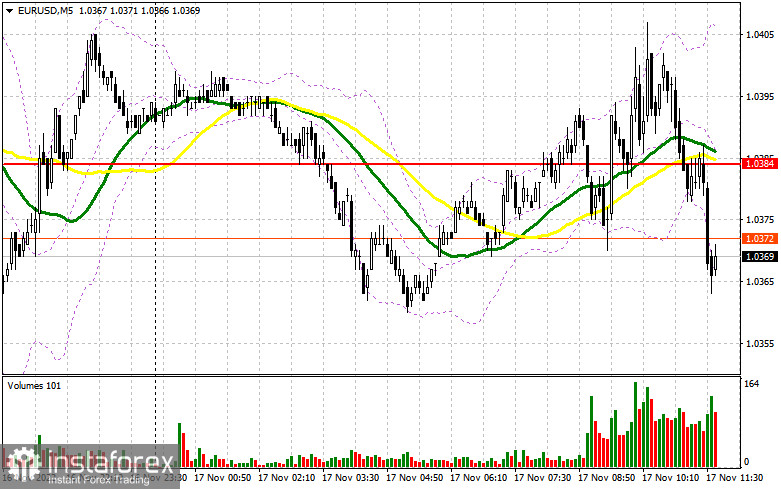
When to open long positions on EUR/USD:
The trajectory of the pair will mainly depend on the market reaction to US macro stats, namely the initial jobless claims report, the retiles sales, and building permits reports. If the US real estate market dwindles more than expected, the pressure on the US currency will return. In this case, the euro is sure to climb higher. If the reading is more or less in line with the forecast, the pair is highly likely to sink. If so, it would be wise not to open long positions until a false breakout of the nearest support level of 1.0333. It will give a buy signal, boosting the uptrend. The pair could rebound to 1.0384. Currently, bulls and bears are tussling for this level. A breakout and a downward retest of this level will open the way to 1.0438 and 1.0478. The bulls will surely regain the upper hand. It will provide an additional buy signal as well. The price may advance the 1.0525 level where I recommend locking in profits. The pressure on the pair will escalate if EUR/USD drops during the US session and bulls show no activity at 1.0333. Another bearish factor will be the hawkish comments of Fed policymakers Loretta Mester and James Bullard. If this scenario comes true, bulls will have close long positions, pushing the pair down. In this case, only a false breakout of the support level of 1.0283 will provide a buying opportunity. You can buy EUR/USD immediately at a bounce from 1.0227 or 1.0180, keeping in mind an upward intraday correction of 30-35 pips.
When to open short positions on EUR/USD:
The bullish sentiment seems to be fading. For the second day in a row, bulls have been unable to push the pair to monthly highs. Apart from that, the ECB has also made hints that it could switch to less aggressive tightening by raising them only by 50 basis points next month. If US data turns out to be upbeat, a strong downward correction is likely to occur. A new sell signal will appear if the pair fails to settle above 1.0384. In this case, the euro is expected to decline to the support level of 1.0333. A drop and upward retest f this level will generate an additional sell signal. Bulls will be forced to close their Stop Loss orders. So, the pair could slip to 1.0283 where I recommend locking in profits. A more distant target will be the 1.0227 level. If the pair approaches this level, it will significantly undermine the bullish trend. If EUR/USD climbs during the US session amid weak US economic reports and bears show no energy at 1.0384, bulls could regain the upper hand. The pair could touch monthly highs of 1.0438 and 1.0478. If bears fail to take control of these levels, it is better to postpone short positions until a false breakout of 1.0525 takes place. You can sell EUR/USD immediately at a bounce from 1.0568, keeping in mind a downward intraday correction of 30-35 pips.
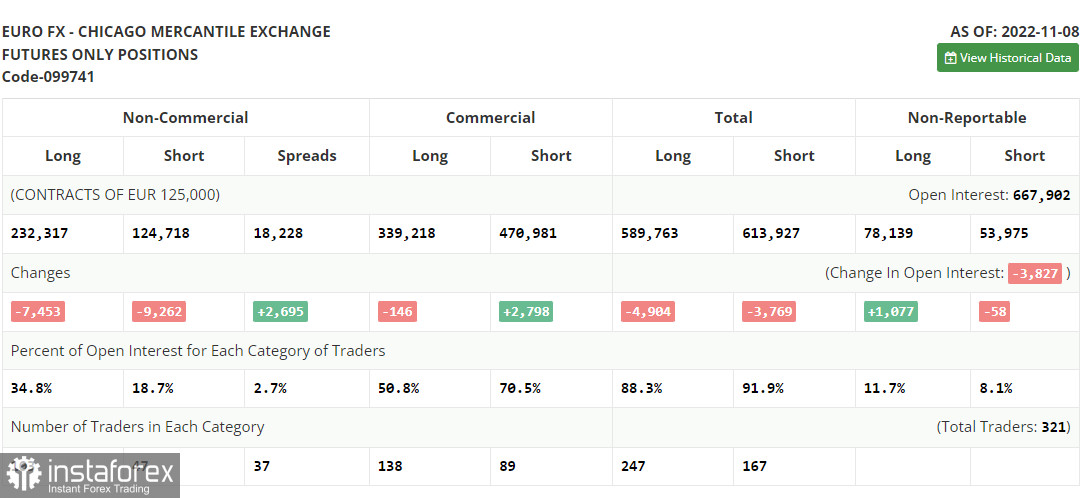
COT report
According to the COT report from November 8, the number of both short and long positions dropped. However, we cannot fully rely on the data since it does not reflect the market situation amid the US inflation figures. The fact is that the US Fed will continue to increase the key interest rate despite a slowdown in consumer price growth. In December, the regulator may raise the benchmark rate by 0.5% or 0.75%. Meanwhile, demand for risk assets, including the euro, has increased. The key reason is a slower pace of the key interest rate hike by the Fed and a further rise in the ECB's interest rate. More and more European politicians are considering a more aggressive approach since it is impossible to cope with surging inflation using moderate measures. However, if the eurozone economy continues to contract that fast, the ECB will hardly switch to a more hawkish stance. This, in turn, will cap the pair's upward potential in the midterm. According to the COT report, the number of long non-commercial positions dropped by 7,453 to 232,317, while the number of short non-commercial positions declined by 9,262 to 124,718. At the end of the week, the total non-commercial net position remained positive at 107,599 against 105,790. This indicates that investors continue benefiting from the situation and buying the cheap euro below parity, as well as accumulating long positions, expecting the end of the crisis. The weekly closing price rose to 1.0104 from 0.9918.
Indicators' signals:
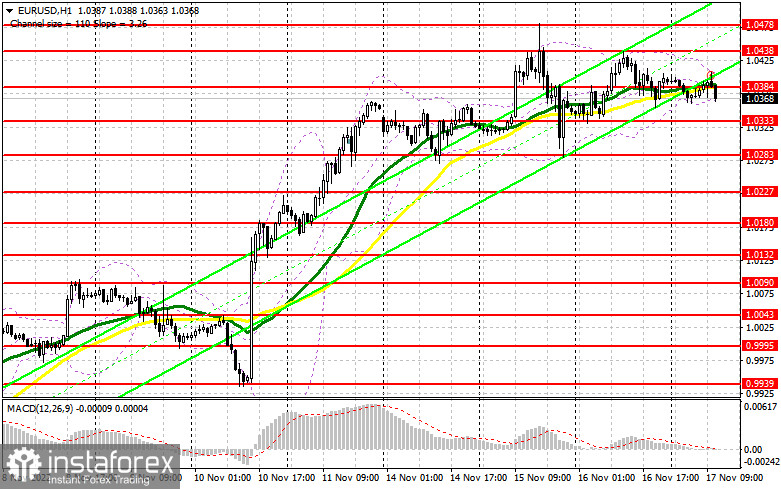
Trading is carried out near the 30 and 50 daily moving averages, indicating market uncertainty.
Moving averages
Note: The period and prices of moving averages are considered by the author on the H1 (1-hour) chart and differ from the general definition of the classic daily moving averages on the daily D1 chart.
Bollinger Bands
If EUR/USD moves down, the indicator's lower border at 1.0363 will serve as support.
Description of indicators
- Moving average (moving average, determines the current trend by smoothing out volatility and noise). Period 50. It is marked yellow on the chart.
- Moving average (moving average, determines the current trend by smoothing out volatility and noise). Period 30. It is marked green on the chart.
- MACD indicator (Moving Average Convergence/Divergence — convergence/divergence of moving averages) Quick EMA period 12. Slow EMA period to 26. SMA period 9
- Bollinger Bands (Bollinger Bands). Period 20
- Non-commercial speculative traders, such as individual traders, hedge funds, and large institutions that use the futures market for speculative purposes and meet certain requirements.
- Long non-commercial positions represent the total long open position of non-commercial traders.
- Short non-commercial positions represent the total short open position of non-commercial traders.
- Total non-commercial net position is the difference between the short and long positions of non-commercial traders.


