


Analysis of GBP/USD, 5-minute chart
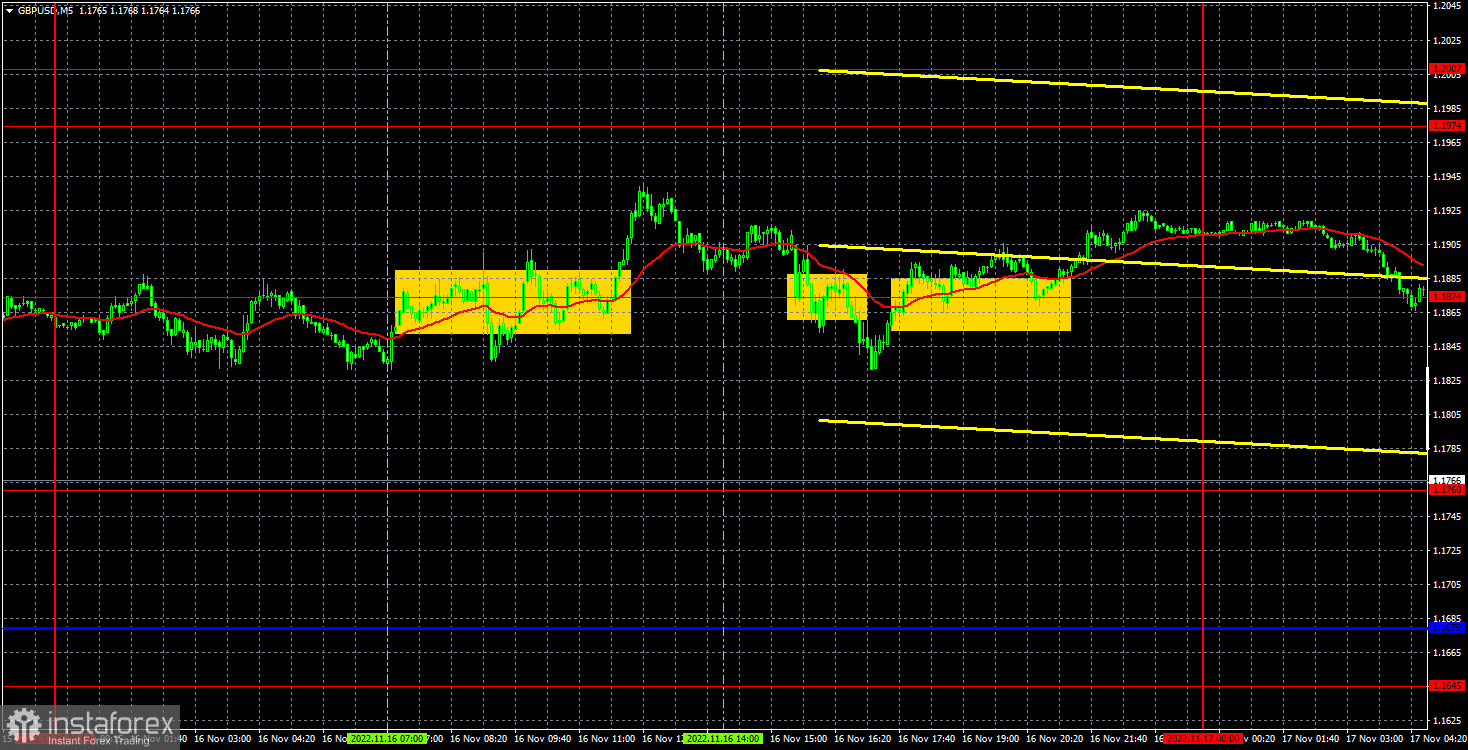
The GBP/USD currency pair was trading ambiguously on Wednesday. Despite the fact that the most important inflation report for October was published in the UK, which showed almost a record acceleration, traders practically did not react to it. We believe that this could have happened due to the development of the same report "in advance". Recall that in the last two weeks, the pound has been growing almost at the speed of light, and not always having specific reasons for that. The US inflation report caused a stir in the foreign exchange market, but it cannot affect the rate of the pair permanently or, say, for several weeks. That's it, it's time to forget about this report and move on. And then the pound has a real chance to fall to the trend line, overcoming which will cancel the current upward trend and allow the pair to continue moving downwards, which, from our point of view, would be much more logical. We don't expect the pound to drop back to its all-time lows around 1.0350 now, there's no good reason for that either, but there isn't one for a rise either. This means consolidation in a fairly wide price range.
In regards to Wednesday's trading signals, the situation was quite difficult. One glance at the chart above is enough to understand exactly how the pair moved during the day. Constant reversals, changes in the direction of movement, the absence of a trend, even within the day. Two false signals were formed even at the European trading session. First, the price settled below the level of 1.1874, and then - above it. All signals of the day were formed only at this level. Therefore, traders could work out the first two. The first was formed during the release of the British inflation report, so it was dangerous to open a trading position. It was necessary to ignore this signal or take risks, but be sure to set Stop Loss, according to which the position was closed in any case. The long position could have been closed at zero profit, as the price went up more than 20 pips. But both in the first and in the second case, it was difficult to exit the market without losses.
COT report
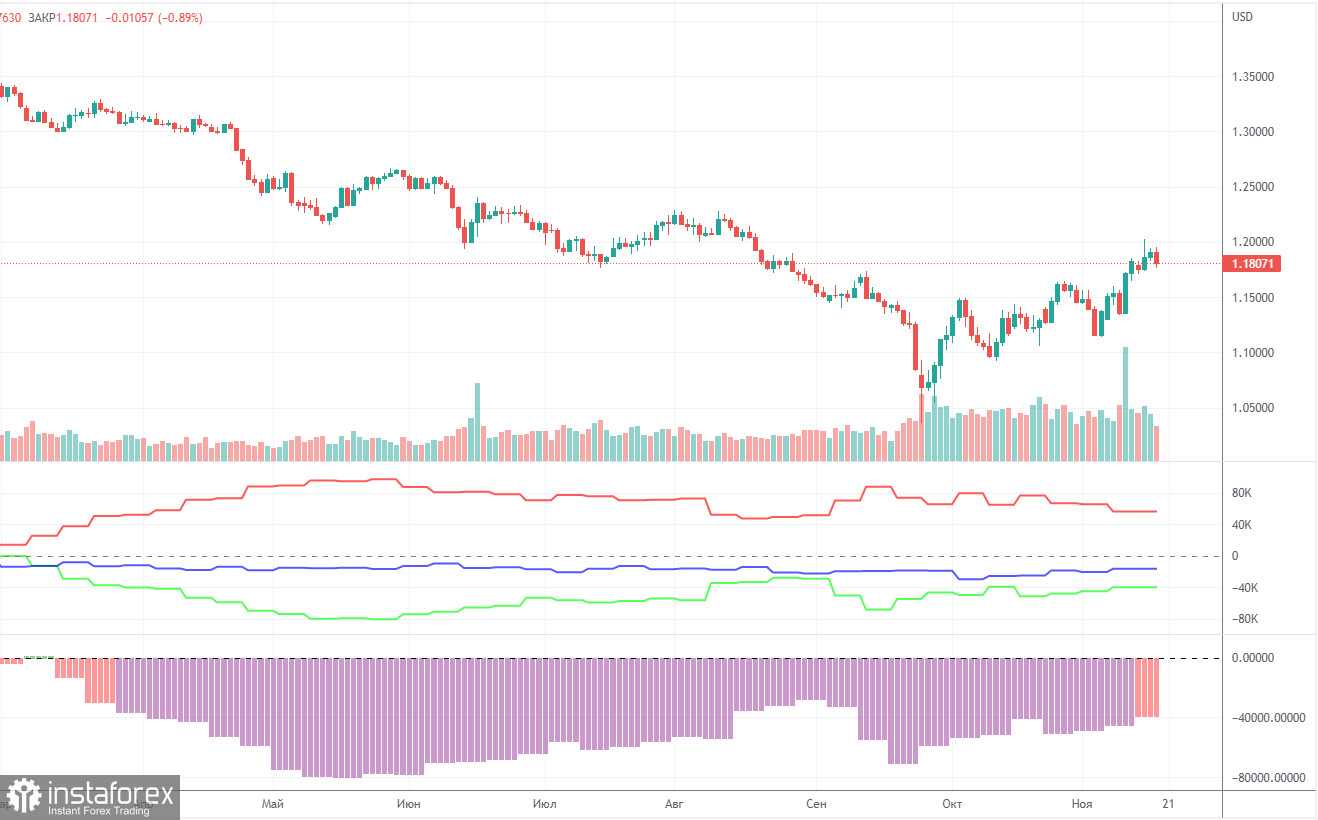
The latest Commitment of Traders (COT) report on the British pound showed a slight weakening of the bearish sentiment. In the given period, the non-commercial group closed 8,500 long positions and 11,500 short positions. Thus, the net position of non-commercial traders increased by 3,000, which is very small for the pound. The net position indicator has been slowly rising in recent weeks, but this is not the first time it has risen, but the mood of the big players remains "pronounced bearish" and the pound remains on a downward trend in the medium term. And, if we recall the situation with the euro, then there are big doubts that based on the COT reports, we can expect a strong growth from the pair. How can you count on it if the market buys the dollar more than the pound?
The non-commercial group has now opened a total of 79,000 shorts and 34,000 longs. The difference, as we can see, is still very big. The euro cannot rise even though major players are bullish, and the pound will suddenly be able to grow in a bearish mood? As for the total number of open longs and shorts, here the bulls have an advantage of 21,000. But, as we can see, this indicator also does not help the pound too much. We remain skeptical about the long-term growth of the British currency, although there are certain technical reasons for this.
Analysis of GBP/USD, 1-hour chart
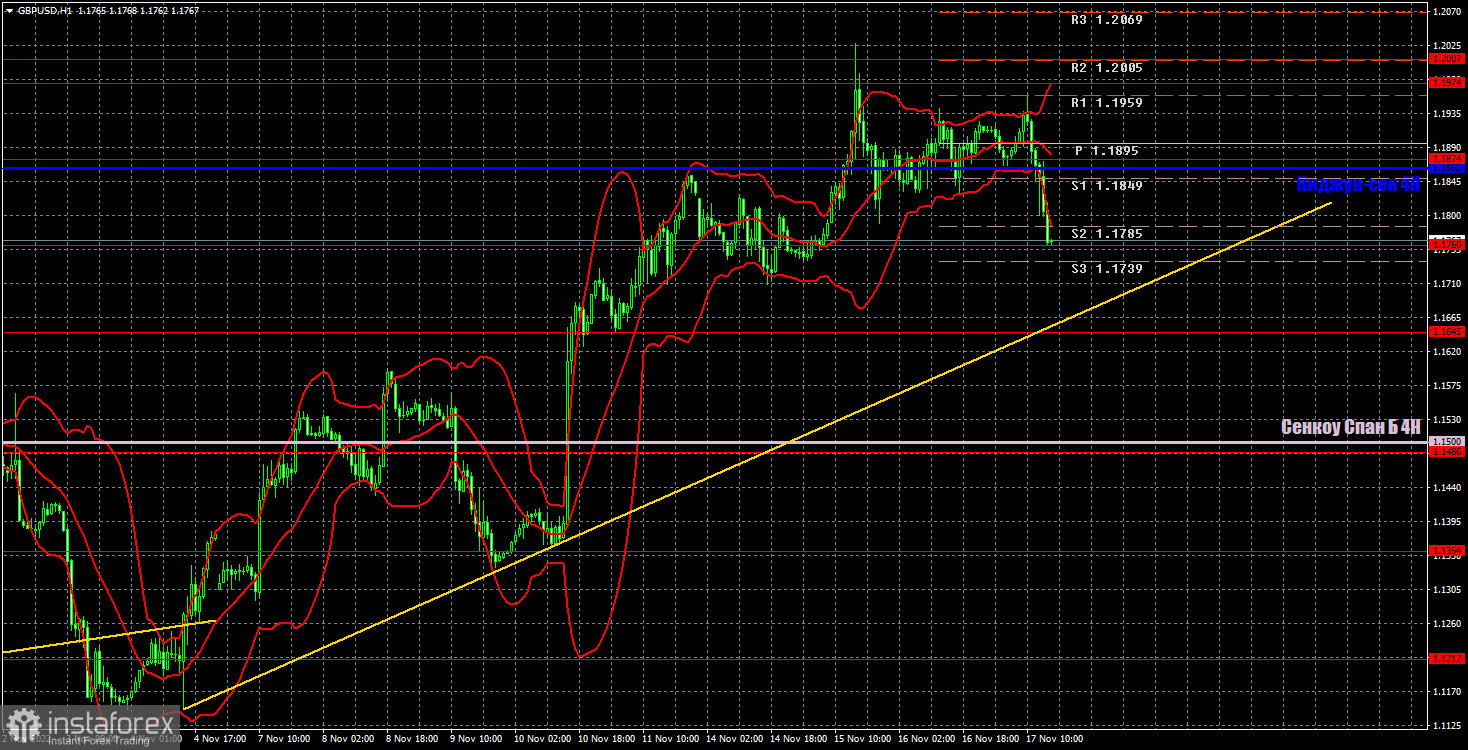
The pound/dollar pair began the long-awaited correction on the one-hour chart. We consider the pound's growth in recent weeks somewhat unfounded, and this week the pound began to correct only on Thursday. However, we expect the decline to continue.
On Thursday, the pair may trade at the following levels: 1.1486, 1.1645, 1.1760, 1.1874, 1.1974-1.2007, 1.2106, 1.2185, 1.2259. Senkou Span B (1.1500) and Kijun-sen (1.1862) lines can also give signals if the price rebounds or breaks these levels. The Stop Loss level is recommended to be set to breakeven when the price passes in the right direction by 20 points. The lines of the Ichimoku indicator may move during the day, which should be taken into account when determining trading signals. Also, there are support and resistance levels that can be used to lock in profits.
There were no important reports and events scheduled for Thursday in the UK and the US, only minor ones. From across the ocean, we received data about applications for unemployment benefits for the next week, and this report once again almost coincided with forecasts. Thus, it could not cause the dollar to fall. The rest of the reports were no better.
What we see on the trading charts:
Price levels of support and resistance are thick red lines, near which the movement may end. They do not provide trading signals.
The Kijun-sen and Senkou Span B lines are the lines of the Ichimoku indicator, moved to the one-hour chart from the 4-hour one. They are strong lines.
Extreme levels are thin red lines from which the price bounced earlier. They provide trading signals.
Yellow lines are trend lines, trend channels, and any other technical patterns.
Indicator 1 on the COT charts reflects the net position size of each category of traders.
Indicator 2 on the COT charts reflects the net position size for the non-commercial group.


