


Details of the economic calendar of November 17
According to Eurostat, annual inflation in the euro area was a record 10.6% in October after 9.9% in September. Forecast assumed a 10.7% figure—a small discrepancy doesn't play a decisive role because inflation is still very high.
In fact, we have a clear signal that the ECB will continue to raise interest rates at the current pace.
During the American trading session, weekly data on jobless claims in the United States were published, which recorded an increase in the overall rate. This is a negative factor for the US labor market.
Statistics details:
The volume of continuing claims for benefits rose from 1.494 million to 1.507 million.
The volume of initial claims for benefits fell from 226,000 to 222,000.
As for the US ballot count, the preliminary totals are:
House of Representatives: Democrats 212 - Republicans 218. Control requires 218 seats out of 435.
Senate: Democrats 50 - Republicans 49. Control requires 51 seats out of 100.
Analysis of trading charts from November 17
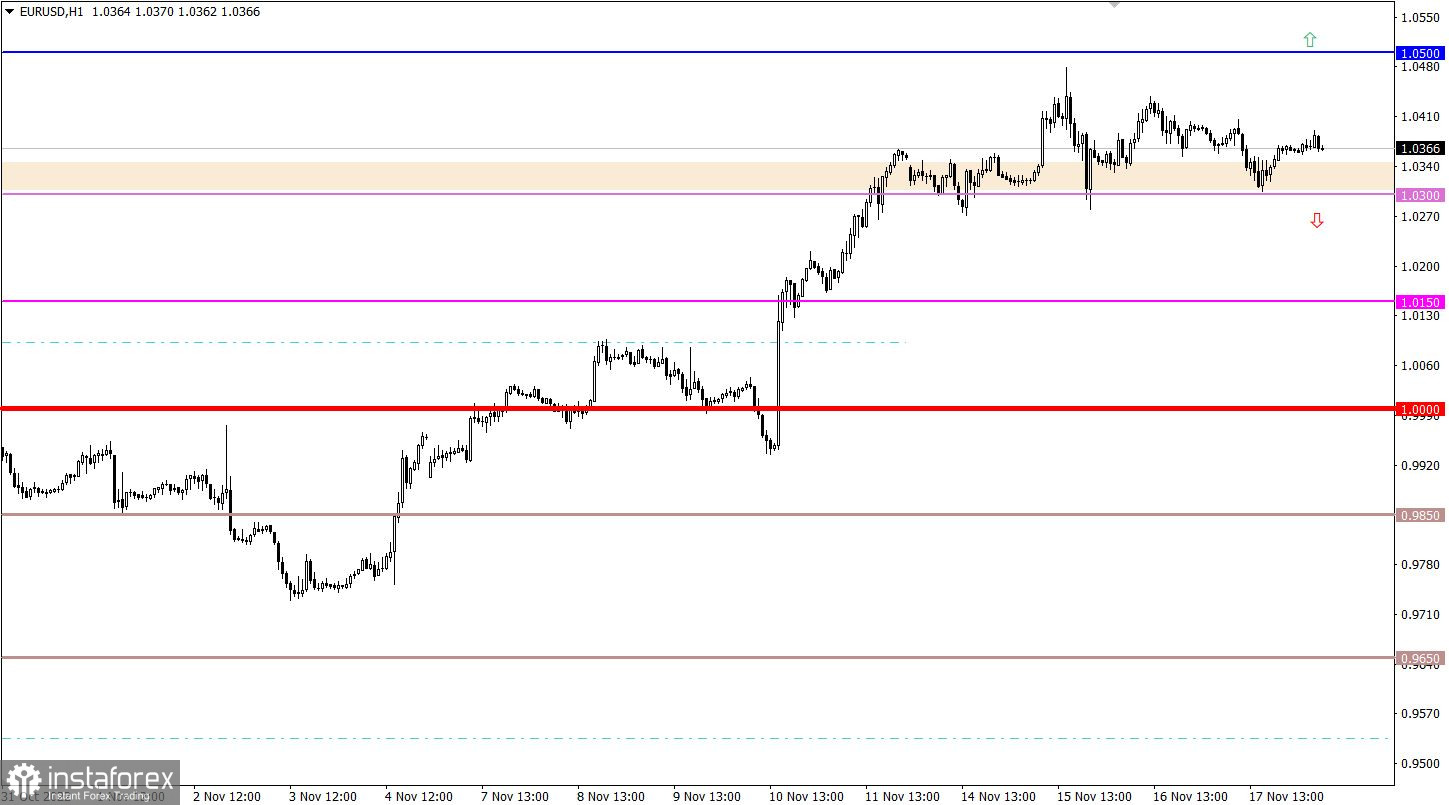
The EURUSD currency pair moved at the beginning to a technical pullback and then to the flat stage after slowing down the upward cycle around the 1.0500 resistance level. The levels 1.0300 and 1.0500 serve as the main boundaries of the side amplitude.
Since the beginning of the trading week, the GBPUSD currency pair has designated two control levels, 1.1750 and 1.2000, relative to which price fluctuations occur. In fact, we have stagnation, despite a fairly wide amplitude, which, in turn, may serve to accumulate trading forces in the upcoming market movement.

Economic calendar for November 18
At the opening of the European trading session, data on UK retail sales were published, the rate of decline of which slowed slightly in annual terms from -6.8% to -6.1%. Month-on-month data reflected a 0.6% increase in sales.
The pound sterling does not react in any way to the statistics.
Trading plan for EUR/USD on November 18
In this situation, the quote will continue to move between the two control levels. This price movement will lead to a regrouping of trading forces, which will become a lever for new speculative price jumps.
The optimal trading strategy is considered to be a breakout method with holding the price outside one or another control level. As a result, a technical signal will be received about the possible subsequent direction of movement.
We concretize the above:
Traders will consider an upside scenario if the price holds above 1.0500 in a four-hour period. This move would extend the current cycle from the low of the downward trend.
The downside scenario will be accepted into work if the price stays below 1.0300. In this case, the probability of the price returning to the level of 1.0150 is high.
Trading plan for GBP/USD on November 18
In this situation, it is possible to work using the rebound method from the given levels, but the breakdown method is considered the most interesting strategy. Thus, the strongest signal to buy or sell the pound sterling will come from the market the moment the price is held outside a certain level relative to the daily period.
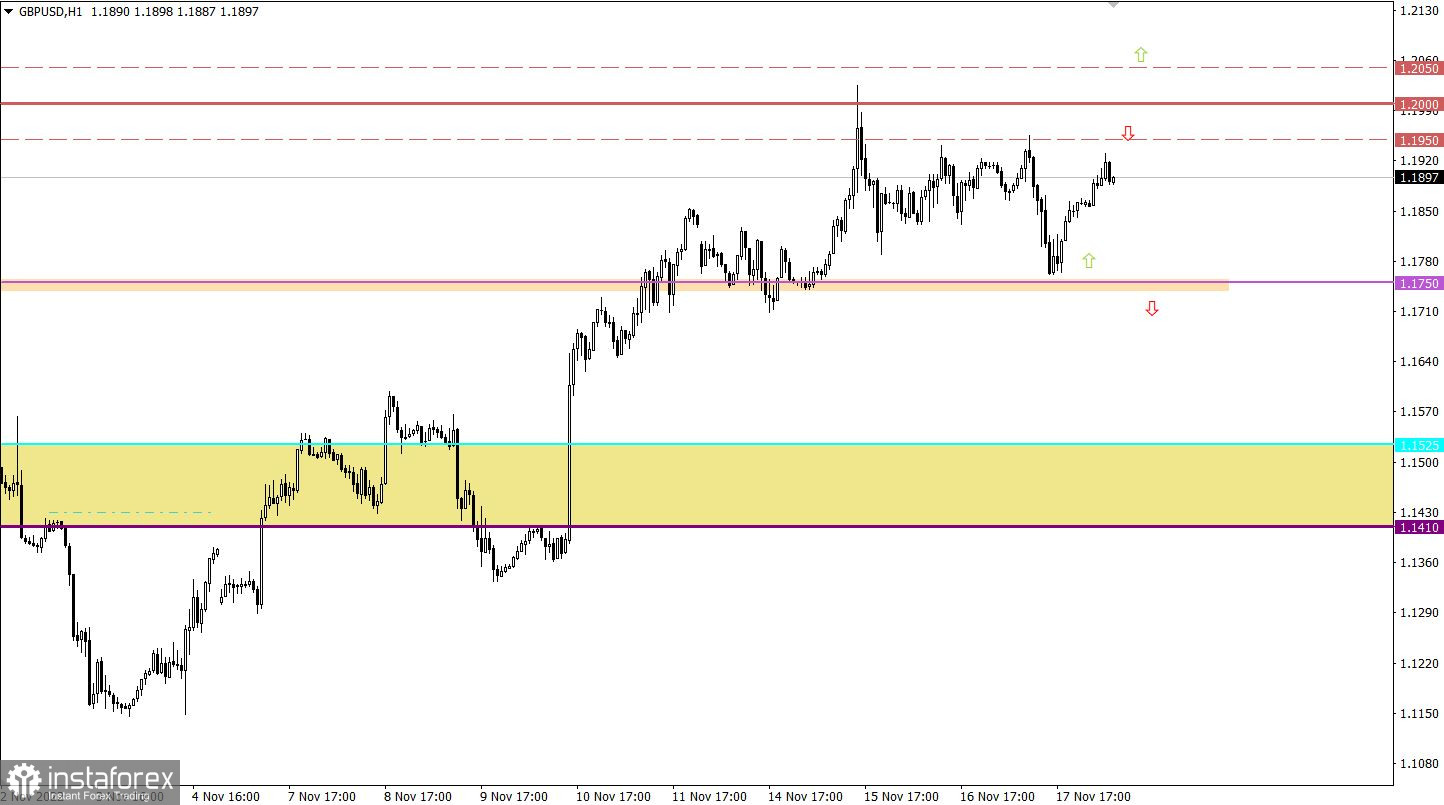
What is shown in the trading charts?
A candlestick chart view is graphical rectangles of white and black light, with sticks on top and bottom. When analyzing each candle in detail, you will see its characteristics of a relative period: the opening price, closing price, and maximum and minimum prices.
Horizontal levels are price coordinates, relative to which a stop or a price reversal may occur. These levels are called support and resistance in the market.
Circles and rectangles are highlighted examples where the price of the story unfolded. This color selection indicates horizontal lines that may put pressure on the quote in the future.
The up/down arrows are the reference points of the possible price direction in the future.


