


Analysis of EUR/USD, 5-minute chart
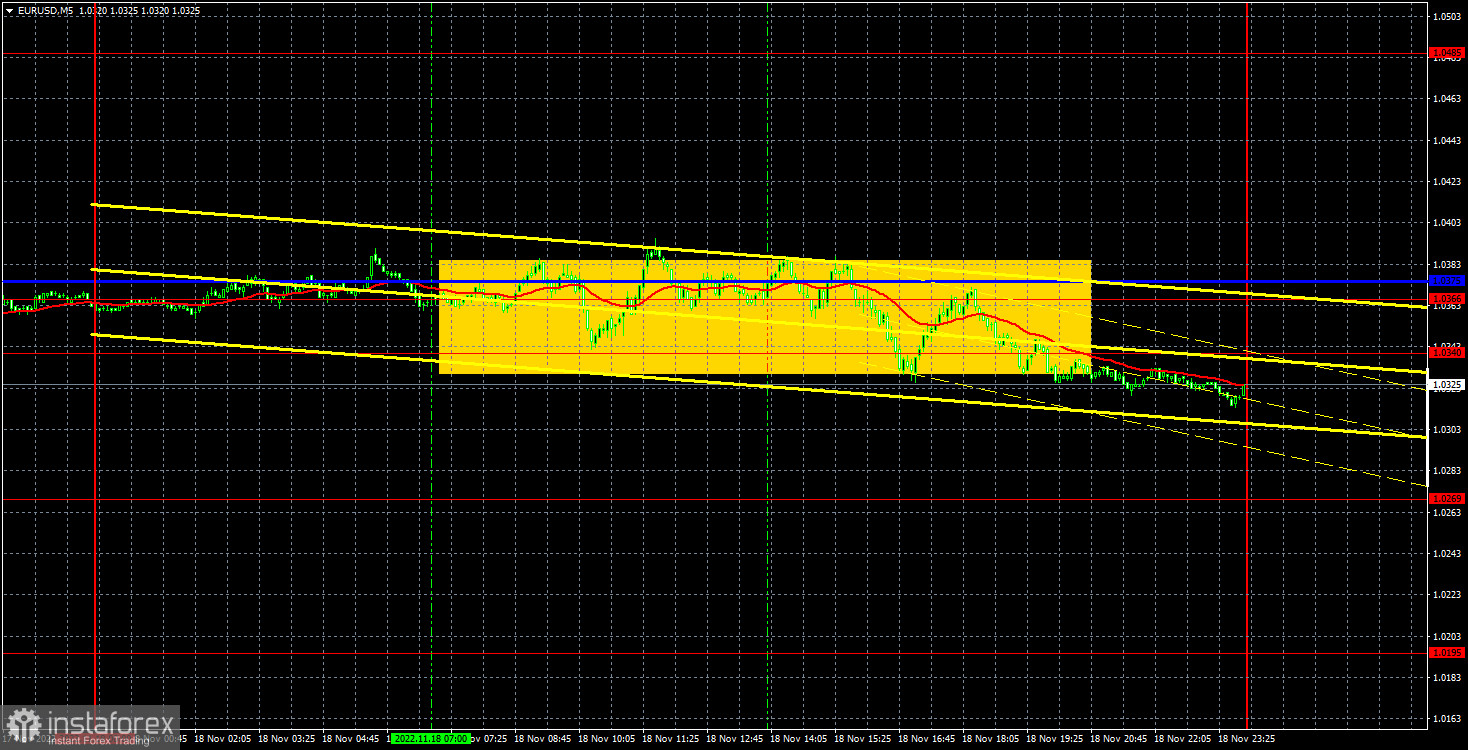
Last Friday, the euro/dollar pair did not show any interesting movement. Despite the fact that over the past week there was quite high volatility, you still can't tell from the charts whether the price has been moving quite actively. The fact is that there was mainly a sideways movement, which is misleading. There is not much to say about the interesting events of this day. European Central bank President Christine Lagarde gave her second speech last week, and said that the central bank was ready to raise the key rate further and warned of a slowdown in economic activity as a necessary measure to bring down inflation. The market has known all this for a long time, so there was no reaction to this speech. And there was nothing else interesting. Last week was generally quite boring for macroeconomic and fundamental events, and the new one will be no better...
The situation with trading signals couldn't be simpler. The pair traded between 1.0340 and 1.0375 all day, only occasionally trying to get out of it. And it was unsuccessful. Thus, traders could open one or two positions when the price tried to leave the horizontal channel, but most likely, they took a small loss on them, because there was no trend. It happens, there is nothing wrong with that. During the last months the pair was in a trend and was volatile, the flat hour has probably come.
COT report
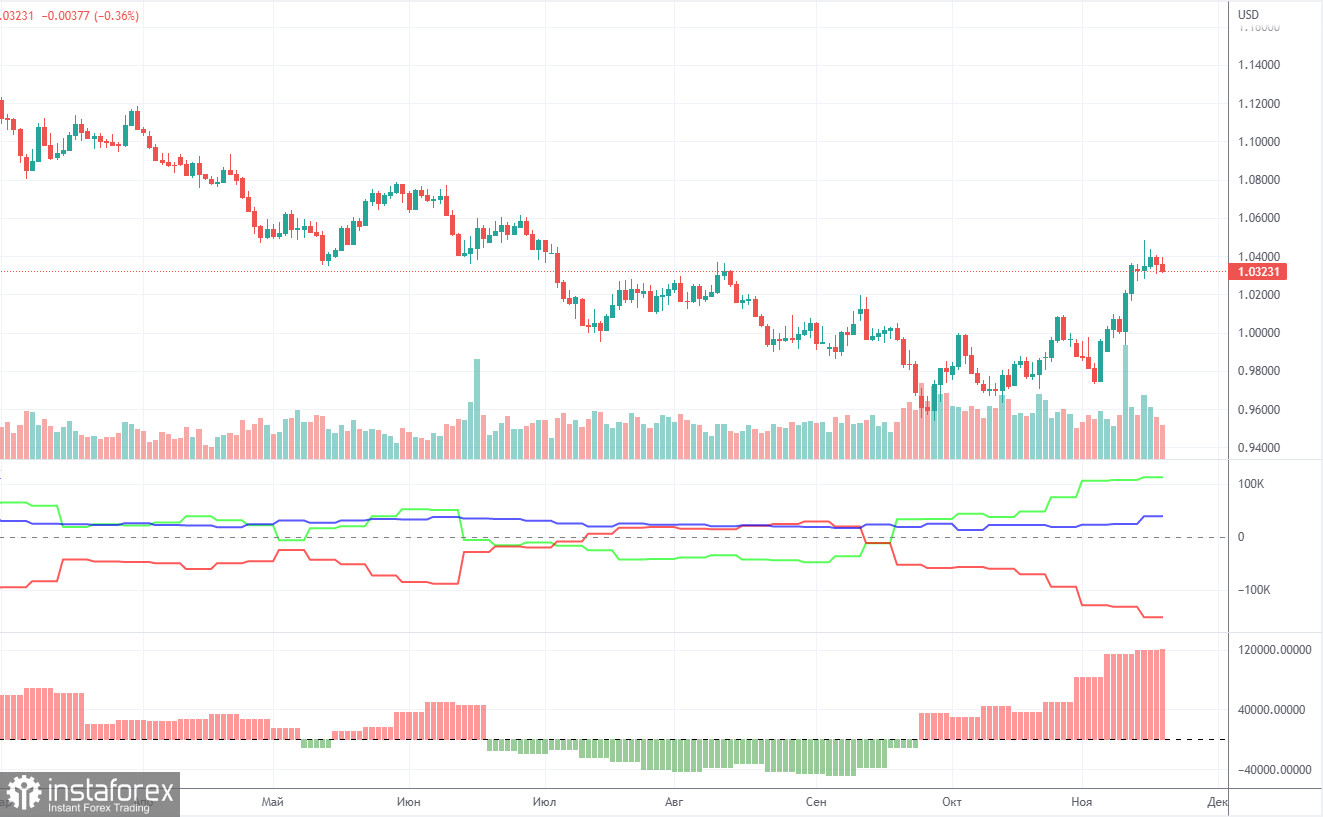
The Commitment of Traders (COT) reports on the euro in 2022 are a paradox. Halfway through the year they showed an outright bullish mood of commercial players, but at the same time the euro was falling steadily. Then for a few months they showed a bearish mood, and the euro also steadily fell. Now the net position of the non-commercial traders is bullish again and getting stronger, and the euro has hardly moved away from its 20-year lows. This is happening, as we said, because demand for the U.S. dollar remains very high amid the difficult geopolitical situation in the world. So even if the demand for the euro is rising, the high demand for the dollar still does not allow the euro itself to rise as much. In the given period, the number of long positions from the non-commercial group increased by 7,000, whereas the number of shorts - by 2,000. As a result, the net position increased by about 5,000 contracts. The euro has been slowly rising in recent weeks, which already coincides with the readings of the COT report. At the same time we think that the dollar will rise due to the same geopolitics or due to the lack of factors for the euro's growth. The green and red lines of the first indicator are far away from each other, which may indicate the end of the uptrend (which, in fact, never happened). The number of longs exceeds the number of shorts by 113,000. Thus, the net position of the non-commercial traders may go on rising but it may not provoke the same growth for the euro. If we look at the overall indicators of open longs and shorts across all categories of traders, then there are 39,000 more shorts (635,000 vs 596,000).
Analysis of EUR/USD, 1-hour chart
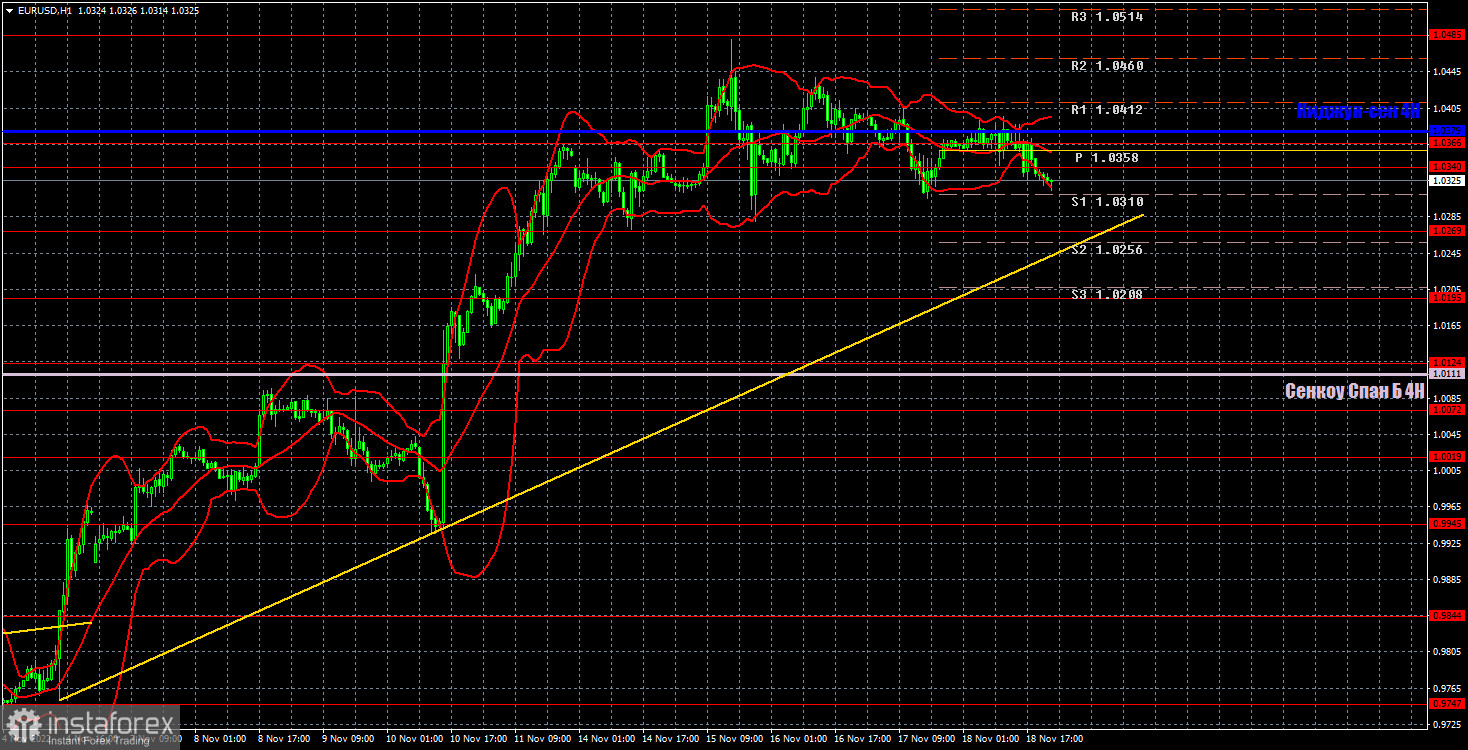
On the one-hour chart, you can see that the pair has been moving sideways for more than a week, while maintaining a fairly high volatility. The uptrend line still retains its relevance, but during a flat, the price can freely overcome it, which would not be considered as a sell signal. We still expect a downward movement. On Monday, the pair may trade at the following levels: 1.0072, 1.0119, 1.0195, 1.0269, 1.0340-1.0366, 1.0485, 1.0579, 1.0637, as well as Senkou Span B lines (1.0111) and Kijun Sen (1.0379). Lines of the Ichimoku indicator may move during the day, which should be taken into account when determining trading signals. There are also support and resistance levels, but signals are not formed near these levels. Bounces and breakouts of the extreme levels and lines could act as signals. Don't forget about stop-loss orders, if the price covers 15 pips in the right direction. This will prevent you from losses in case of a false signal.
There are no important events for November 21 in the EU and the USA. Therefore, the market will not react to anything today. High volatility is likely to persist and so will the flat.
What we see on the trading charts:
Price levels of support and resistance are thick red lines, near which the movement may end. They do not provide trading signals.
The Kijun-sen and Senkou Span B lines are the lines of the Ichimoku indicator, moved to the one-hour chart from the 4-hour one. They are strong lines.
Extreme levels are thin red lines from which the price bounced earlier. They provide trading signals.
Yellow lines are trend lines, trend channels, and any other technical patterns.
Indicator 1 on the COT charts reflects the net position size of each category of traders.
Indicator 2 on the COT charts reflects the net position size for the non-commercial group.


