


Trend analysis (Fig. 1).
The pound-dollar pair may move downward from the level of 1.1885 (closing of Friday's daily candle) to 1.1689, the 38.2% retracement level (yellow dotted line). When testing this level, an upward movement is possible to the upper fractal at 1.2026 (yellow dotted line). Upon testing this level, the price may continue to move up.
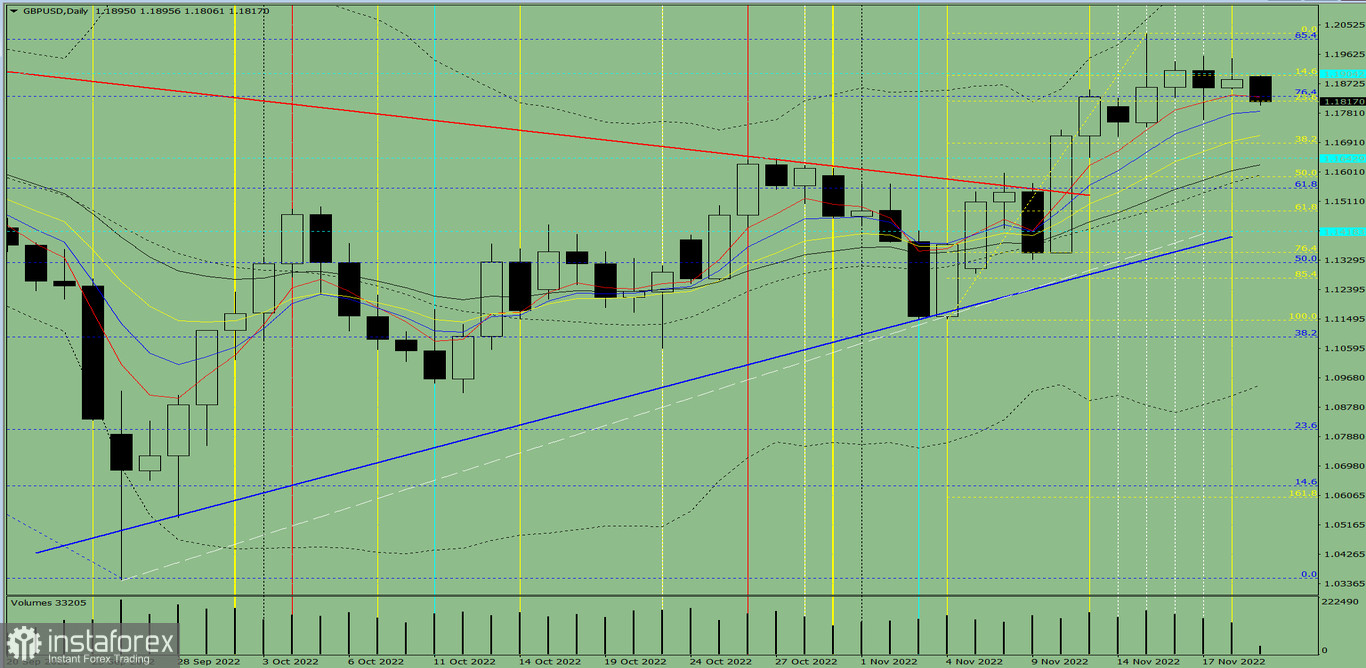
Fig. 1 (daily chart).
Comprehensive analysis:
- Indicator analysis - down;
- Fibonacci levels - down;
- Volumes - down;
- Candlestick analysis - down;
- Trend analysis - up;
- Bollinger bands - up;
- Weekly chart - down.
General conclusion:
Today, the price may move downward from the level of 1.1885 (closing of Friday's daily candle) to 1.1689, the 38.2% retracement level (yellow dotted line). When testing this level, an upward movement is possible to the upper fractal at 1.2026 (yellow dotted line). Upon testing this level, the price may continue to move up.
Alternatively, the price may move downward from the level of 1.1885 (closing of Friday's daily candle) to 1.1715, the 13-period EMA (thin yellow line). When testing this level, an upward movement is possible with the target of 1.1833, the 76.4% retracement level (blue dotted line). Upon testing this level, the price may continue to move up.


