


Details of economic calendar for November 18
UK retail sales data indicated a slight slowdown in the year-on-year decline from -6.8% to -6.1%. Month-on-month sales rose by 0.6%.
The pound sterling did not react to the statistics.
As for the US ballot counting, the results are as follows:
House of Representatives: Democrats secured 212 votes, while Republicans got 218 votes. It is necessary to win 218 out of 435 seats to gain control.
Senate: Democrats secured 50 votes, while Republicans got 49 votes. The party needs to win 51 out of 100 seats to gain control.
Notably, some US states are still counting/disputing votes. However, the overall picture is clear: Democrats retained control of the Senate and Republicans won control of the House of Representatives.
Analysis of trading chart for November 18
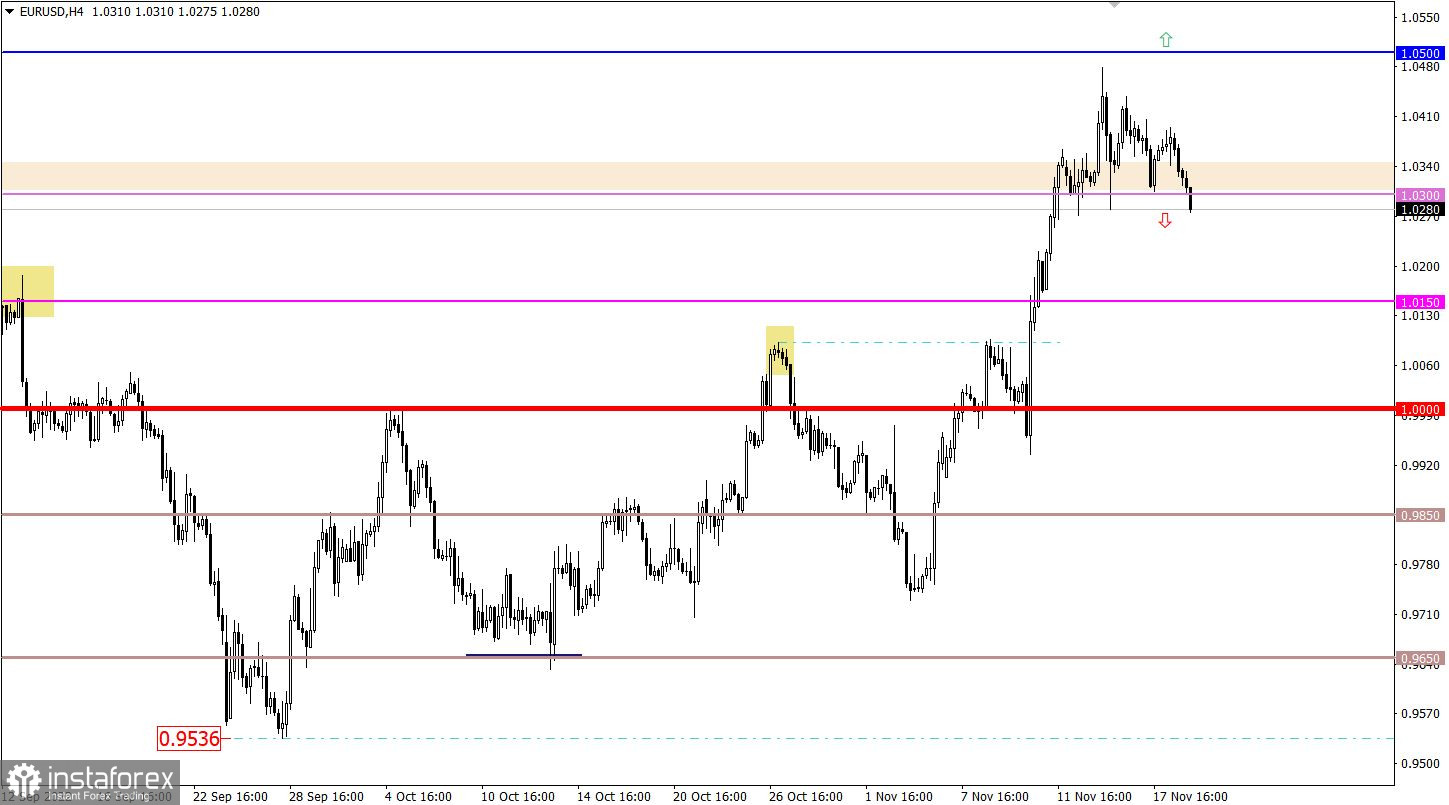
Last week, the EUR/USD pair slowed the upward cycle around the resistance level of 1.0500. As a result, the volume of long positions decreased, which led to the amplitude fluctuation at 1.0300/1.0500.
The GBP/USD pair is moving along a fairly regular amplitude within two control levels despite the price fluctuations: 1.1750 and the lower boundary of the psychological level 1.1950/1.2000.
Economic calendar for November 21
Traditionally, there are no entries in the macroeconomic calendar on Monday. Important statistical indicators in the EU, the UK and the US are not due to be released.
Therefore, investors and traders will be guided by the incoming news flow.
Trading plan on EUR/USD for November 21
The volume of short positions increased as a new trading week started. Moreover, the rise in short positions led to the breakout of the level 1.0300 on the downward trajectory. Stable price retention below that level might indicate a move from the stagnation stage into a full-blown correction, taking into account that the euro still has a characteristic overbought signal.
Traders will consider an alternative scenario for the market in case the price returns above the level of 1.0300. In this case, the renewal of the amplitude of 1.0300/1.0400 is possible.
Trading plan on GBP/USD for November 21
In this case, fundamental changes may occur only after the price retains beyond any level at least within the four-hour period. Until then the risk of price rebound will remain. Therefore, the subsequent formation of a sideways channel is likely.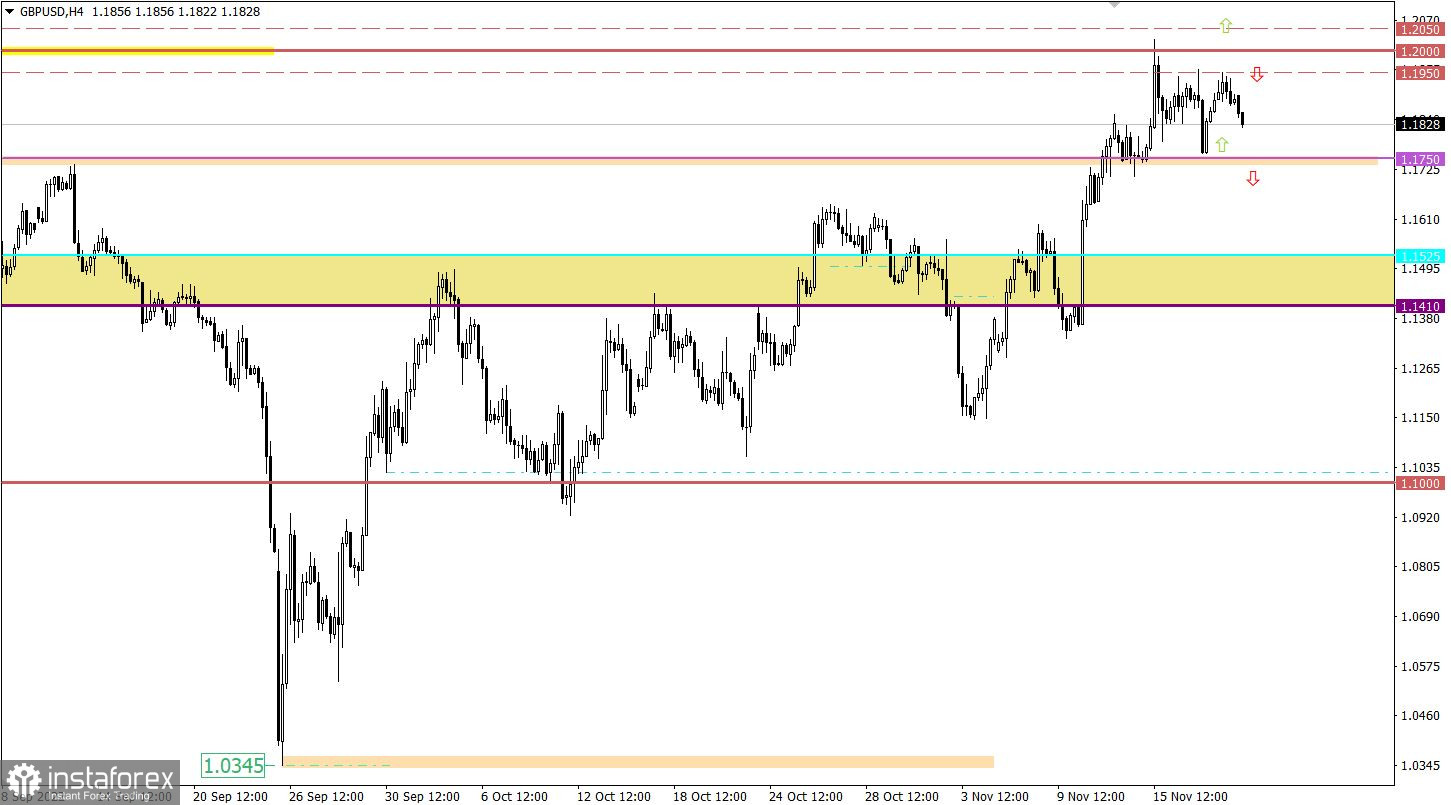
What do trading charts indicate?
The candlestick chart shows graphical white and black rectangles with upward and downward lines. While conducting a detailed analysis of each individual candlestick, it is possible to notice its characteristic relative to a particular time period: the opening price, the closing price, the maximum and minimum price;
Horizontal levels are price coordinates, in relation to which a stop or reversal of the price may occur. They are called support and resistance levels ;
Circles and rectangles are highlighted examples where the price reversed during its history. This color highlighting indicates horizontal lines which can exert pressure on the quote in the future;
Upward/downward arrows signal possible future price direction.


