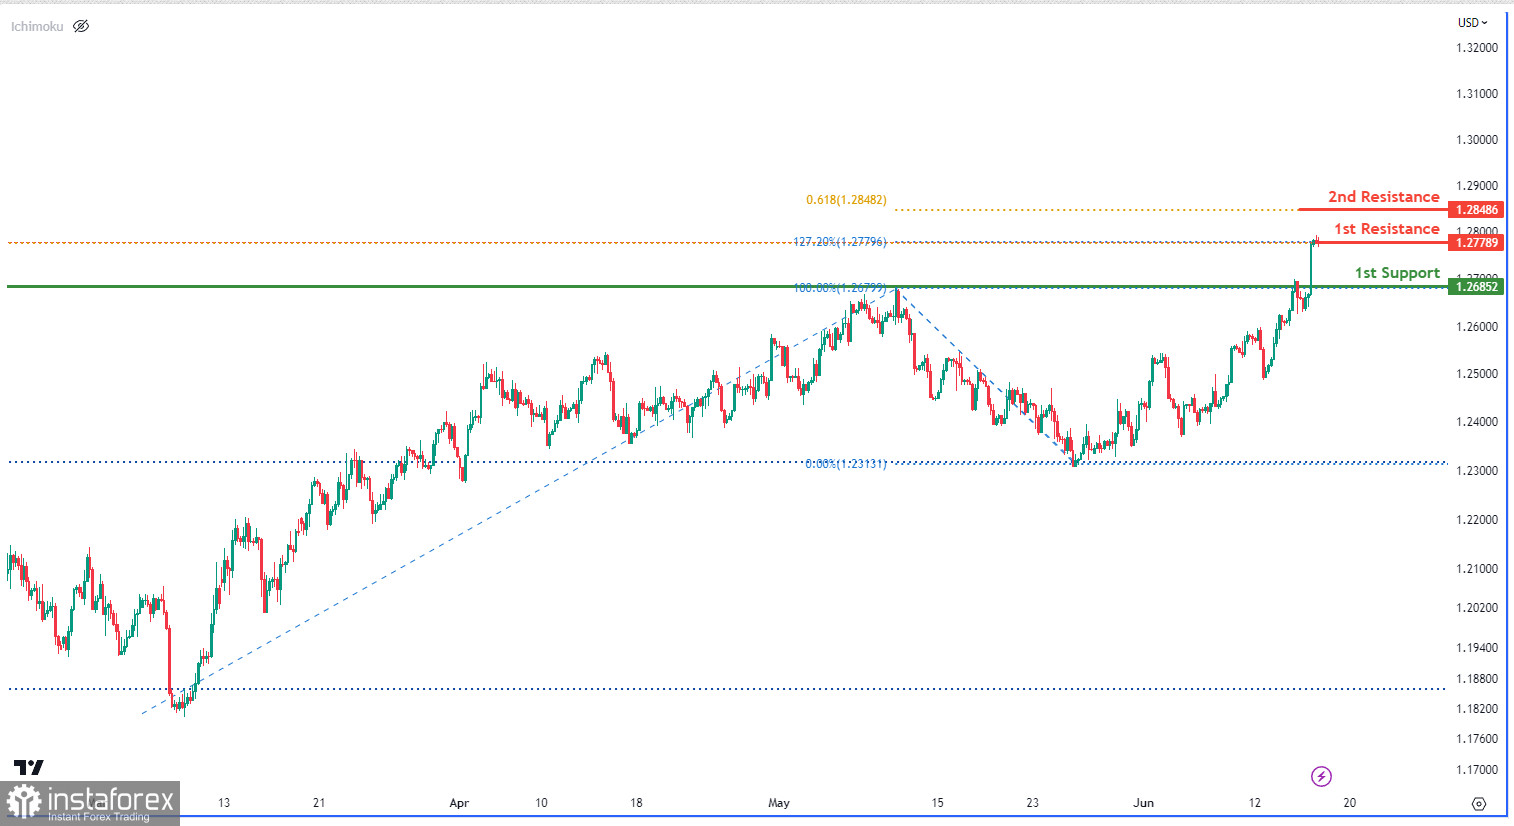
The GBP/USD chart reflects a strong bearish momentum, indicating a downward trend in the market. Traders and investors should consider the possibility of a bearish reaction at the first resistance level of 1.3778, which could lead to a subsequent decline towards the first support level at 1.2685. The first support level at 1.2685 is significant as a pullback support, attracting potential buyers and providing price stability. Conversely, the first resistance level at 1.3778 acts as a notable swing high resistance, potentially hindering upward price movements. Additionally, the presence of the 61.80% Fibonacci Projection adds significance to the second resistance level at 1.2848, highlighting it as a potential area of resistance.


