


Analyzing Monday trades:
GBP/USD on 30M chart
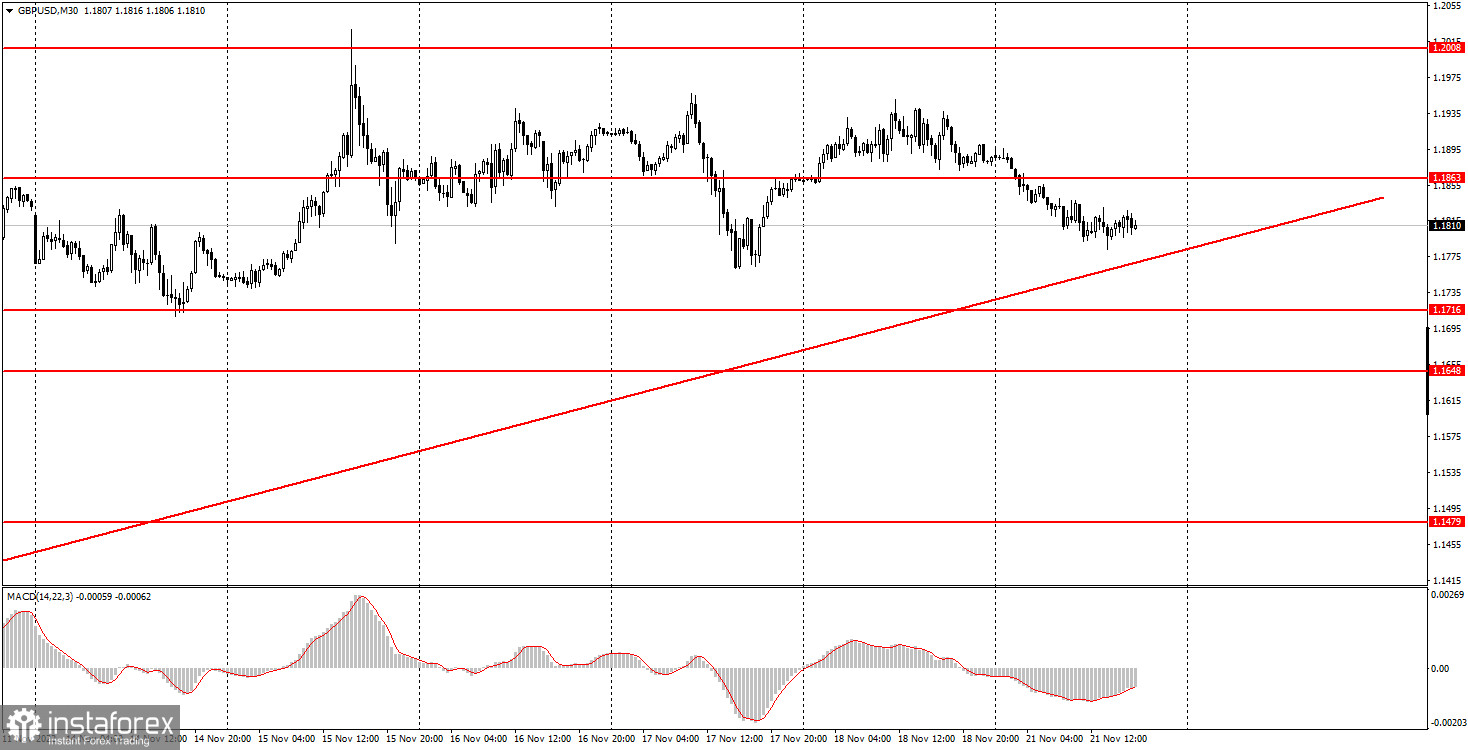
GBP/USD moved lower on Monday without any fundamental reasons. There was no important macroeconomic news or any other fundamental background. Yet, a fall in the pound was hardly surprising. It was already obvious last week that GBP had exhausted its upside momentum and that a strong downside correction was about to start soon. The correction will be logical since the recent rise of the pair was not supported by anything. However, the pair is still holding above the trendline, so the uptrend is still in place. I expect the pair to break below this line and develop a downtrend. This week, nothing important is expected in the US and the UK. So, the market may reveal its true intentions when not influenced by external factors.
GBP/USD on M5 chart
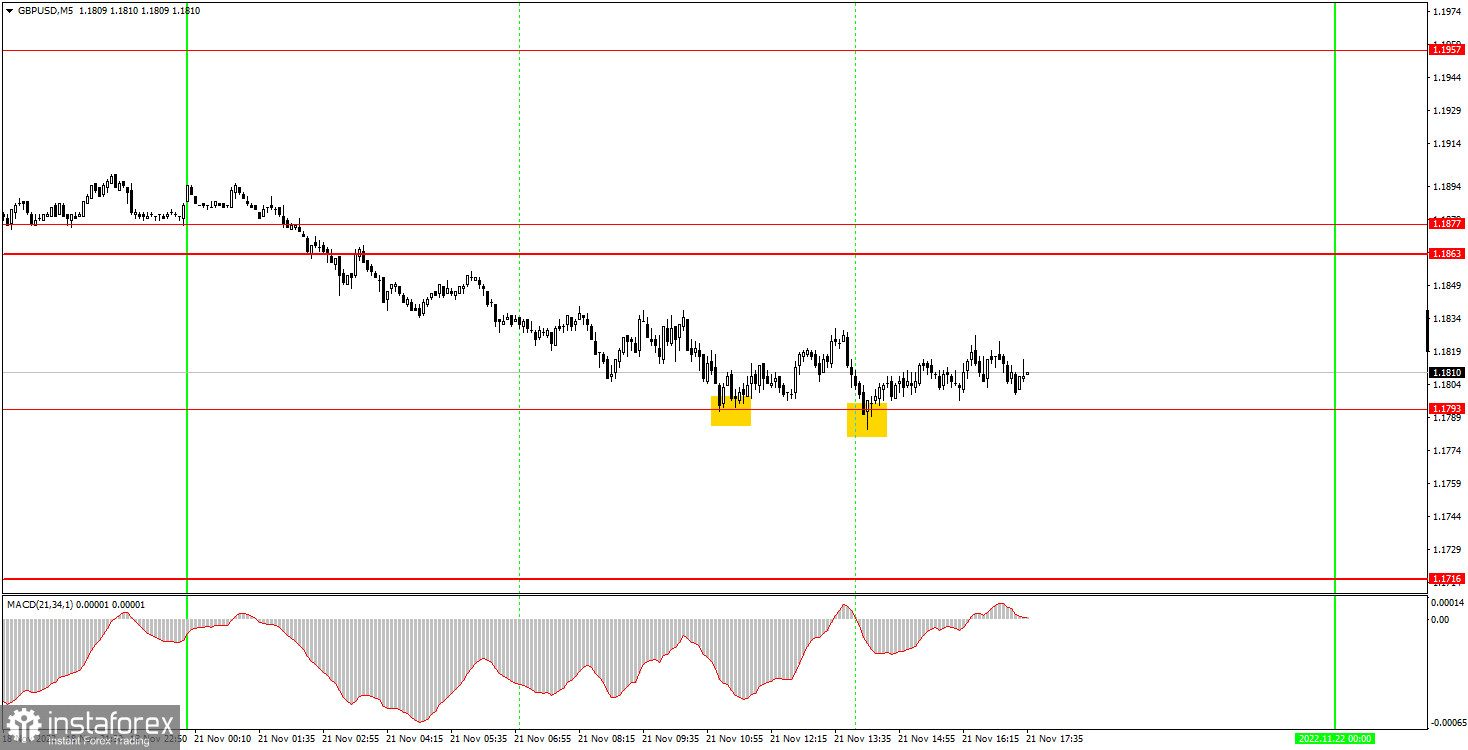
On the 5-minute time frame, trading signals were not so good. Traders couldn't take advantage of the downward movement as the only signal that we had emerged late at night. The first signal that should have been followed was a buy signal formed near the level of 1.1793. As the pair was falling throughout the day, the buy signal didn't bring any profit. Nevertheless, the pair moved to the upside by more than 20 pips after both rebounds from the level of 1.1793. So, traders should have set a Stop Loss to breakeven on both long positions. Actually, both positions were closed as the Stop Loss was triggered. Otherwise, traders could have closed them earlier with a small profit. The first day of the trading week cannot be called profitable but at least there were no losses.
Trading tips on Tuesday:
The pound/dollar pair continues to move up on the 30-minute time frame, supported by the ascending trendline. I still think that the instrument will depreciate in the coming weeks so the price will break below this trendline sooner or later. If this happens, the pound will develop a proper downtrend. On the 5-minute chart on Tuesday, it is recommended to trade at the levels of 1.1550, 1.1608, 1.1648, 1.1716, 1.1793, 1.1863-1.1877, 1.1967, and 1.1994. As soon as the price passes 20 pips in the right direction, you should set a Stop Loss to breakeven. No important events are scheduled either in the UK or the US on Tuesday. This means that the market will have no strong drivers to follow. On Monday, the trend movement was rather weak which means that the price may decline slowly and may enter a flat channel.
Basic rules of the trading system
1) The strength of the signal is determined by the time it took the signal to form (a rebound or a breakout of the level). The quicker it is formed, the stronger the signal is.
2) If two or more positions were opened near a certain level based on a false signal (which did not trigger a Take Profit or test the nearest target level), then all subsequent signals at this level should be ignored.
3) When trading flat, a pair can form multiple false signals or not form them at all. In any case, it is better to stop trading at the first sign of a flat movement.
4) Trades should be opened in the period between the start of the European session and the middle of the US trading hours when all positions must be closed manually.
5) You can trade using signals from the MACD indicator on the 30-minute time frame only amid strong volatility and a clear trend that should be confirmed by a trendline or a trend channel.
6) If two levels are located too close to each other (from 5 to 15 pips), they should be considered support and resistance levels.
On the chart
Support and Resistance levels are the levels that serve as targets when buying or selling the pair. You can place Take Profit near these levels.
Red lines are channels or trend lines that display the current trend and show in which direction it is better to trade now.
The MACD indicator (14, 22, and 3) consists of a histogram and a signal line. When they cross, this is a signal to enter the market. It is recommended to use this indicator in combination with trend patterns (channels and trendlines).
Important announcements and economic reports that can be found on the economic calendar can seriously influence the trajectory of a currency pair. Therefore, at the time of their release, we recommend trading as carefully as possible or exiting the market in order to avoid sharp price fluctuations.
Beginners on Forex should remember that not every single trade has to be profitable. The development of a clear strategy and money management is the key to success in trading over a long period of time.


